


1 引入依赖
<dependency>
    <groupId>io.micrometer</groupId>
    <artifactId>micrometer-spring-legacy</artifactId>
    <version>1.3.20</version>
</dependency>
<dependency>
    <groupId>io.micrometer</groupId>
    <artifactId>micrometer-registry-prometheus</artifactId>
    <version>1.3.20</version>
</dependency>
<dependency>
    <groupId>org.springframework.boot</groupId>
    <artifactId>spring-boot-starter-security</artifactId>
</dependency>
2 yml配置
- 设置management.context-path(与spring boot 2.X 默认值相同)
- 指定management.port,独立于业务端口
- security.user.name、security.user.password配置账号密码(密码要使用强密码)
endpoints:
  prometheus:
    enabled: true
management:
  context-path: /actuator
  port: 8087
security:
  user:
    name: test
    password: BAKFX$3l
3 验证
http://localhost:8087/actuator/prometheus
访问接口,第一次需要输入账号、密码。
4 prometheus
prometheus.yml 新增
- job_name: 'spring-actuator'
  metrics_path: '/actuator/prometheus'
  scrape_interval: 5s
  static_configs:
    - targets: ['localhost:8087']
5 grafana
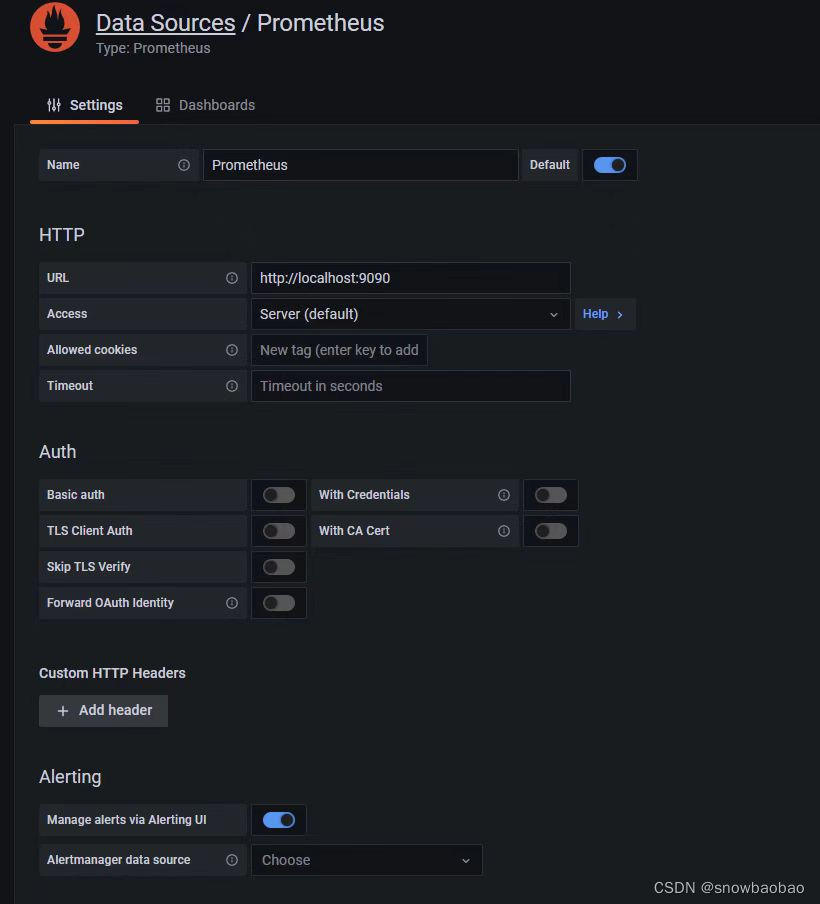
5.1 配置prometheus数据源
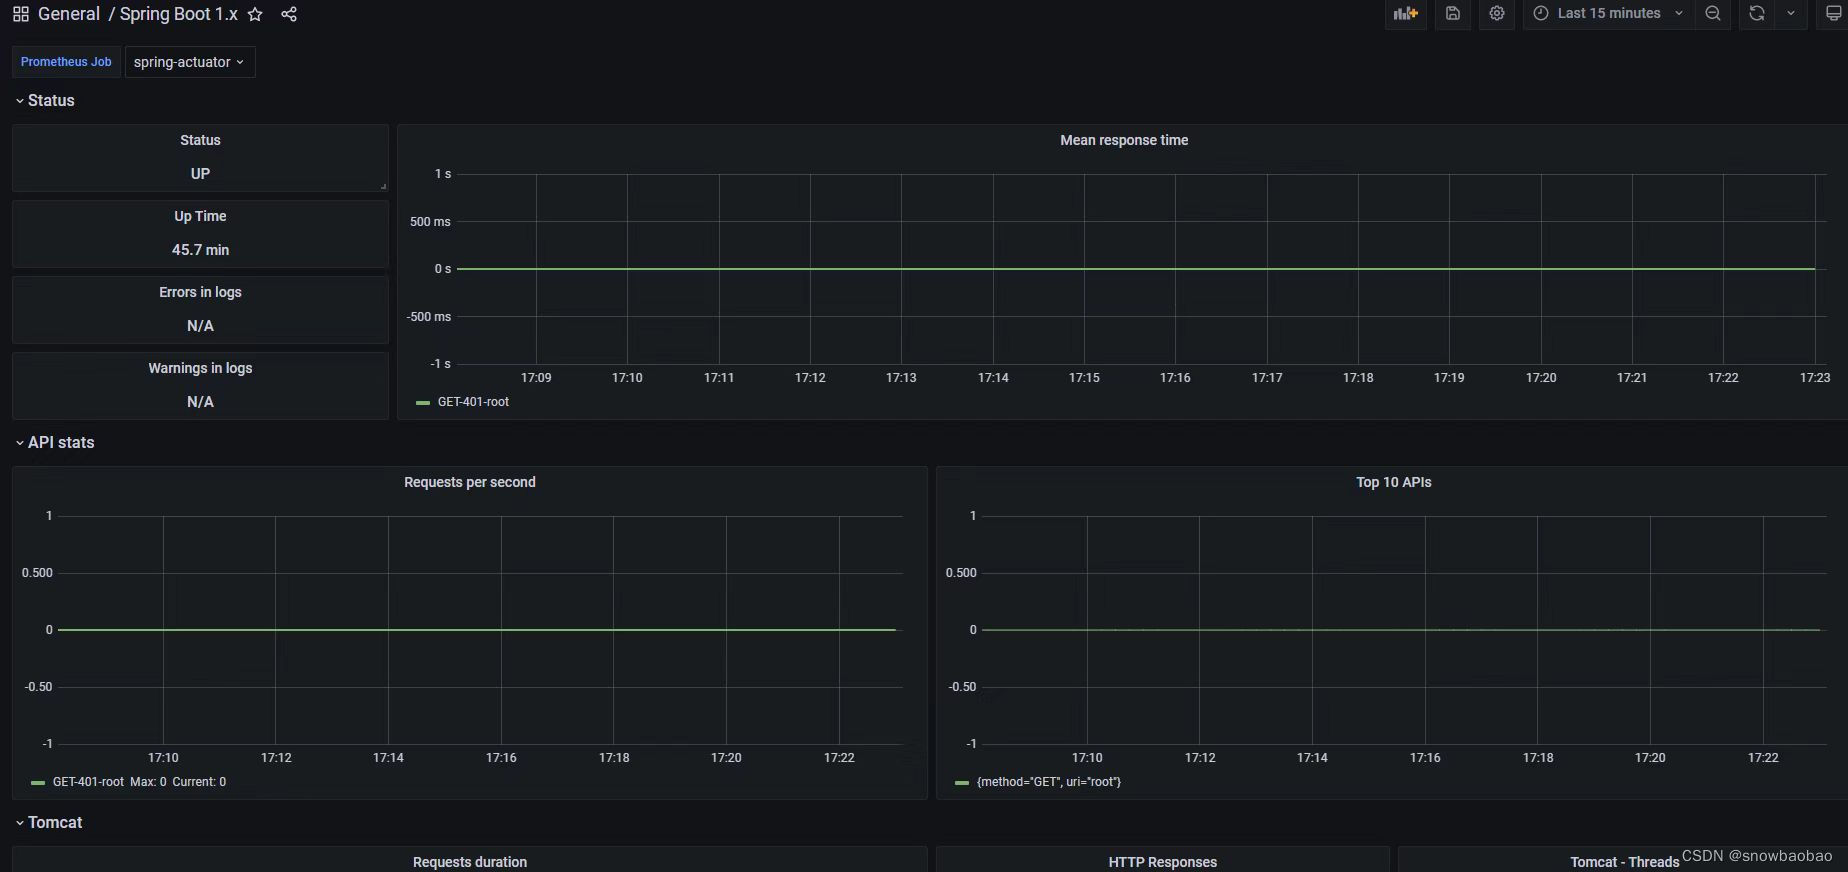
5.2 配置面板
https://grafana.com/grafana/dashboards/
搜索spring boot
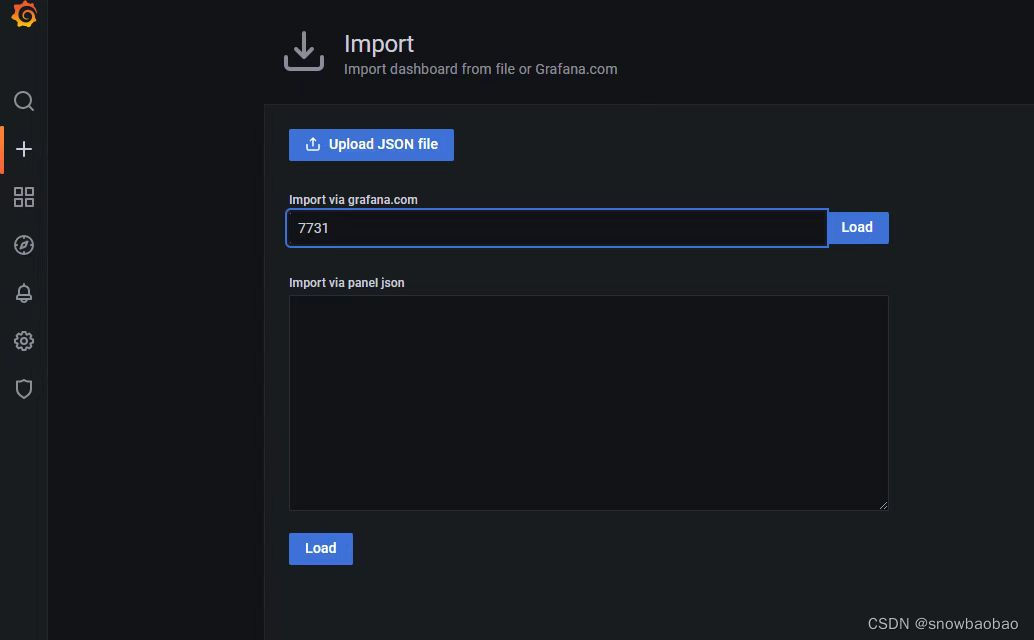


 2993
2993


 被折叠的 条评论
为什么被折叠?
被折叠的 条评论
为什么被折叠?
 到【灌水乐园】发言


