


客户端集成prothmethus 端点
目前的环境是:
- springboot-1.5.9.RELEASE
- promethus 2.18.1
- grafana6.0.0
加入promethus依赖
<dependencies>
   <dependency>
      <groupId>org.springframework.boot</groupId>
      <artifactId>spring-boot-starter-web</artifactId>
   </dependency>

   <dependency>
      <groupId>org.springframework.boot</groupId>
      <artifactId>spring-boot-devtools</artifactId>
      <scope>runtime</scope>
      <optional>true</optional>
   </dependency>
   <dependency>
      <groupId>org.projectlombok</groupId>
      <artifactId>lombok</artifactId>
      <optional>true</optional>
   </dependency>

   <dependency>
      <groupId>org.springframework.boot</groupId>
      <artifactId>spring-boot-starter-actuator</artifactId>
   </dependency>

   <dependency>
      <groupId>org.aspectj</groupId>
      <artifactId>aspectjweaver</artifactId>
   </dependency>
   <!-- The client -->

   <dependency>
      <groupId>io.micrometer</groupId>
      <artifactId>micrometer-registry-prometheus</artifactId>
      <version>1.0.3</version>
   </dependency>
   <dependency>
      <groupId>io.micrometer</groupId>
      <artifactId>micrometer-spring-legacy</artifactId>
      <version>1.0.3</version>
   </dependency>

   <dependency>
      <groupId>org.springframework.boot</groupId>
      <artifactId>spring-boot-starter-test</artifactId>
      <scope>test</scope>
      <exclusions>
         <exclusion>
            <groupId>org.junit.vintage</groupId>
            <artifactId>junit-vintage-engine</artifactId>
         </exclusion>
      </exclusions>
   </dependency>
</dependencies>
加入配置文件
@Configuration

public class MicrometerConfiguration {


    @Value("${spring.application.name}")

    private String applicationName;


    @Bean

    MeterRegistryCustomizer meterRegistryCustomizer(MeterRegistry meterRegistry) {

        return meterRegistry1 -> {

            meterRegistry.config()

                    .commonTags("application", StringUtils.isEmpty(applicationName)?"sample-applicaton"

                            :applicationName);

        };

    }
}
修改yml文件或properties文件
management:

  security:

    enabled: false

spring:

  application:

    name: springboot-sample
启动项目
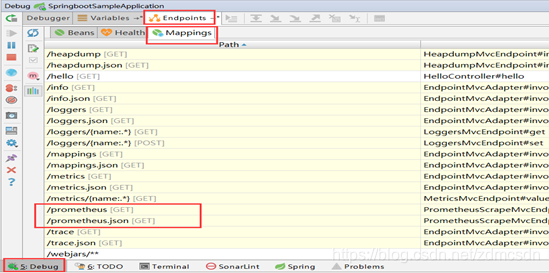
完成项目启动后,可以在控制台->endpoints->mappings中看到暴露的promethus端点
安装prothmethus
windows 安装prothmethus
下载prothmethus windows安装包,官网地址
https://prometheus.io/download/
目前使用的版本是prometheus-2.18.1.windows-amd64
配置promethus
下载完成安装包后,加压在任何位置,修改prometheus.yml文件主要修改的部分是标红的部分
# my global config

global:

  scrape_interval:     10s # Set the scrape interval to every 15 seconds. Default is every 1 minute.

  evaluation_interval: 10s # Evaluate rules every 15 seconds. The default is every 1 minute.

  scrape_timeout: 10s

  # scrape_timeout is set to the global default (10s).


# Alertmanager configuration

alerting:

  alertmanagers:

  - static_configs:

    - targets:

      # - alertmanager:9093


# Load rules once and periodically evaluate them according to the global 'evaluation_interval'.

rule_files:

  # - "first_rules.yml"

  # - "second_rules.yml"


# A scrape configuration containing exactly one endpoint to scrape:

# Here it's Prometheus itself.

scrape_configs:

  # The job name is added as a label `job=<job_name>` to any timeseries scraped from this config.

  - job_name: 'sample-scrape'

    metrics_path: '/prometheus'

    # metrics_path defaults to '/metrics'

    # scheme defaults to 'http'.


    static_configs:

    - targets: ['localhost:8080']
  - job_name: 'dgp-scrape'

    metrics_path: '/crDgp/prometheus'

    # metrics_path defaults to '/metrics'

    # scheme defaults to 'http'.


    static_configs:

    - targets: ['localhost:9090']
tips:分别监控了两个项目,一个jobName是sample-scrape,项目地址和端口是localhost:8080 ,暴露的端点是 /prometheus,另一个是dgp-scrape ,地址和端口是 localhost:9090,暴露端点是 /crDgp/promethus
启动promethus项目
prometheus.exe --web.listen-address=0.0.0.0:8888 --web.enable-lifecycle
- --web.listen-address=0.0.0.0:8888 表示启动在8888端口
- --web.enable-lifecycle 表示允许使用managementapi
访问localhost:8888 查看页面
查看目标列表 status->targets
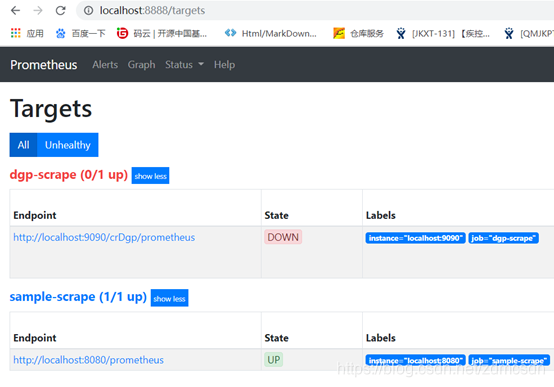
可以看到那些主机down了,那些是正常的
linux docker安装和启动项目
docker run -d --name prometheus -p 8888:9090 -m 500M -v /opt/soft/prometheus/prometheus.yml:/prometheus.yml -v /opt/soft/prometheus/data:/data prom/prometheus --config.file=/prometheus.yml --log.level=info
其他步骤和windows一致,不再赘述
安装grafana
windows安装使用grafana
获取安装包
我使用的版本是: 6.0.0
启动grafana
到bin目录下,执行grafana-server.exe
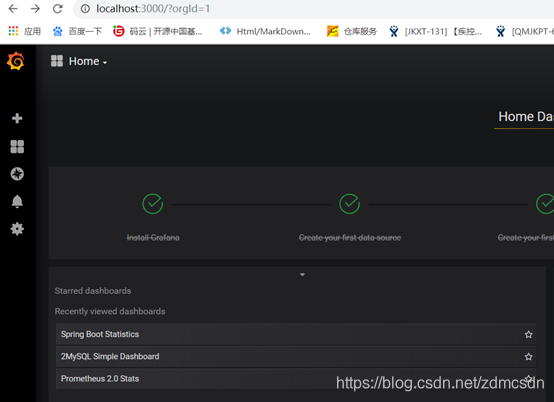
访问:localhost:3000,默认的用户名和密码都是admin
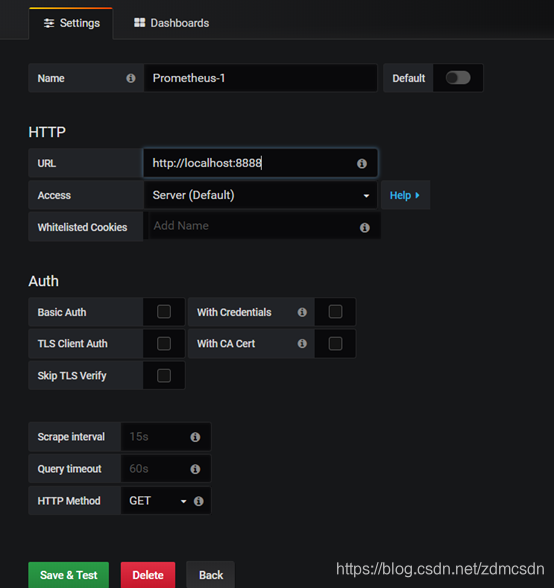
添加promethus数据源
configuration->add data source ->选择promethus,填写信息并保存
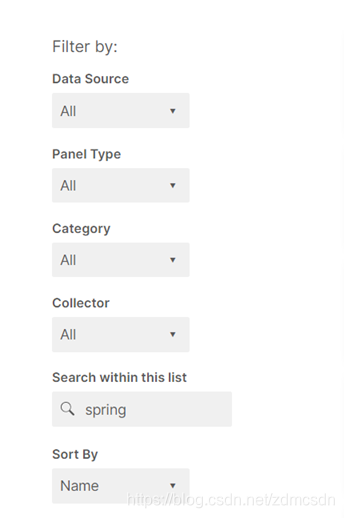
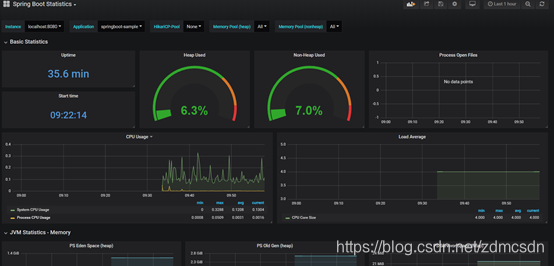
添加统计看板
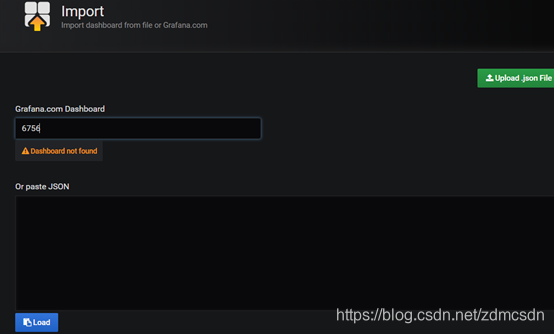
- 看板模板库地址:https://grafana.com/dashboards
- 搜索
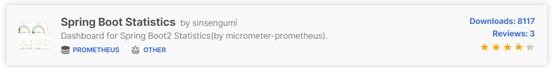
找到
复制id
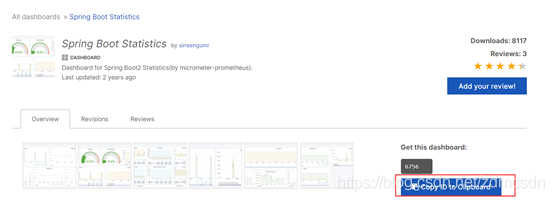
回到grafana安装看板
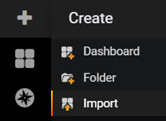
+->import
粘贴id并等待
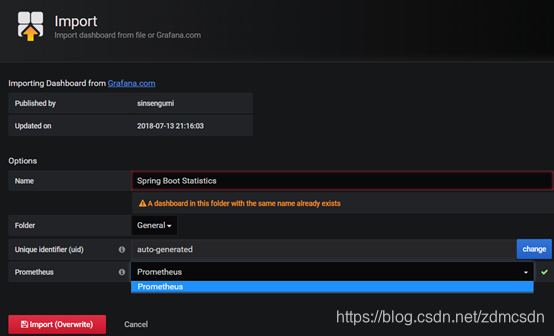
选择promethus数据源
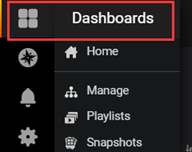
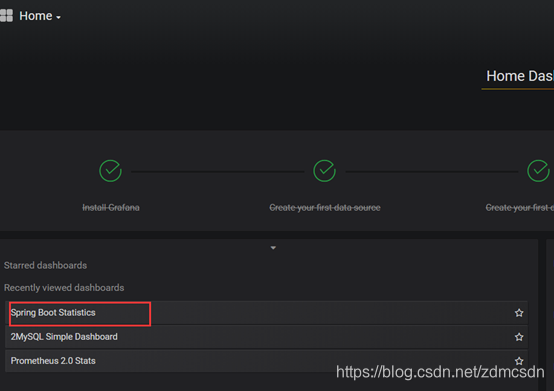
查看看板
linux安装和启动grafana
docker run --name grafana -d -p 3000:3000 -v /opt/soft/grafana:/var/lib/grafana -e "GF_SMTP_ENABLED=true" grafana/grafana
注意: 一定要将/opt/soft/grafana 这个目录授权为777 否则会报没有权限错误,这个目录是为了存储相关配置信息,防止镜像删除后,配置信息也丢失
我们可通过http://ip:3000访问Grafana网页界面(缺省的帐号/密码为admin/admin)
其他步骤和windows一致,不再赘述


 1万+
1万+

 被折叠的 条评论
为什么被折叠?
被折叠的 条评论
为什么被折叠?
 到【灌水乐园】发言


