


quiver 使用介绍
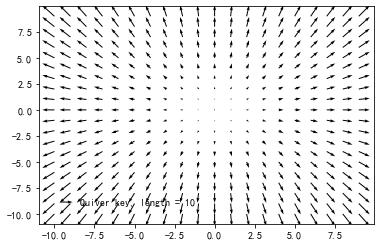
1 quiver官网例子
import matplotlib.pyplot as plt
import numpy as np

X = np.arange(-10, 10, 1)
Y = np.arange(-10, 10, 1)
U, V = np.meshgrid(X, Y)

fig, ax = plt.subplots()
q = ax.quiver(X, Y, U, V)
ax.quiverkey(q, X = 0.1, Y = 0.1, U=10,
             label = r'Quiver key, length = 10', labelpos='E')

plt.show()
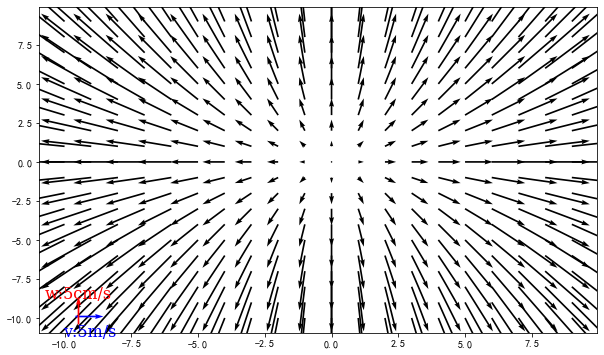
2 quiver 和 quiverkey参数实例
import matplotlib.pyplot as plt
import numpy as np

fig1,ax1 = plt.subplots(1,1,figsize = (10,6))

X = np.arange(-10, 10, 1)
Y = np.arange(-10, 10, 1)
U, V = np.meshgrid(X, Y)

font = {'family' : 'serif',
        'weight' : 'normal',
        'size'   : 16,
        }

##画出风速
h1 = ax1.quiver(X,Y,U,V,     #X,Y,U,V 确定位置和对应的风速
                width = 0.003, #箭杆箭身宽度
                scale = 100,    # 箭杆长度,参数scale越小箭头越长
                )

#画出风场,和箭头箭轴后,得说明 箭轴长度与风速的对应关系
#调用quiver可以生成 参考箭头 + label。
ax1.quiverkey(h1,                      #传入quiver句柄
              X=0.09, Y = 0.051,       #确定 label 所在位置,都限制在[0,1]之间
              U = 5,                    #参考箭头长度 表示风速为5m/s。
              angle = 0,            #参考箭头摆放角度。默认为0,即水平摆放
             label='v:5m/s',        #箭头的补充:label的内容  +
             labelpos='S',          #label在参考箭头的哪个方向; S表示南边
             color = 'b',labelcolor = 'b', #箭头颜色 + label的颜色
             fontproperties = font,        #label 的字体设置:大小,样式,weight
             )

#由于风有U\V两个方向,最好设置两个方向的参考箭头 + label
ax1.quiverkey(h1, X=0.07, Y = 0.071,
              U = 5,
              angle = 90,           #参考箭头摆放角度,90即垂直摆放
              label = 'w:5cm/s',    #label内容
              labelpos='N',         #label在参考箭头的北边
              color = 'r',          #箭头颜色
              labelcolor = 'r',     #label颜色
              fontproperties = font)

##虽然也可以用plt.text来设置label和箭头,但是会比较繁琐。
2.1 quiver常用参数
- width参数:决定箭头箭轴宽度。
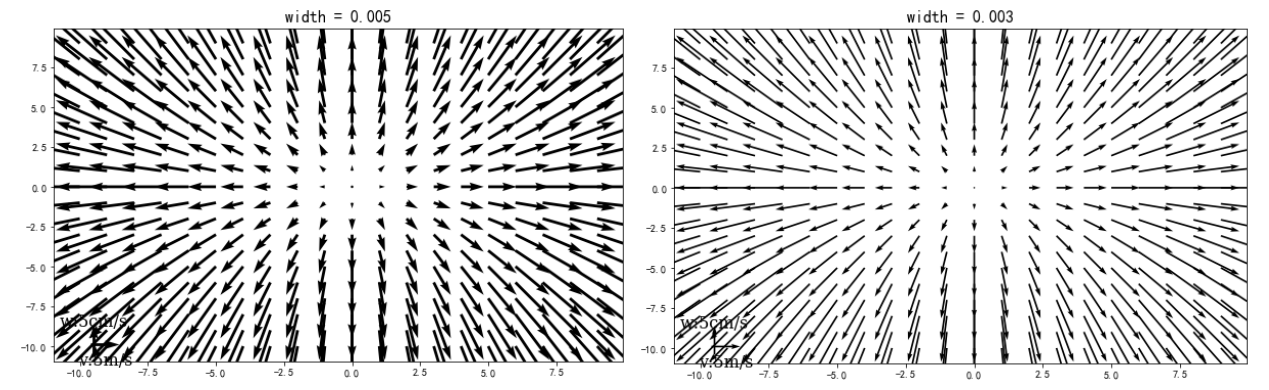
- scale参数:决定箭杆长度
![[外链图片转存失败,源站可能有防盗链机制,建议将图片保存下来直接上传(img-QU0PAT17-1583034025244)(quiver 使用介绍.assets/image-20200301003834241.png)]](https://i-blog.csdnimg.cn/blog_migrate/ab838ee6b3304f4caa1e96579472eae4.png)
其他的参数可以查看 ax.quiver? 进行查看。也可以参考 博客python matplotlib quiver——画箭头、风场,有比较详细的中文解释。
2.2 quiverkey参数介绍
-
Call signature::

  quiverkey(Q, X, Y, U, label, **kw)

Arguments:

  *Q*:
    The Quiver instance returned by a call to quiver.

  *X*, *Y*:
    The location of the key; additional explanation follows.

  *U*:
    The length of the key

  *label*:
    A string with the length and units of the key

Keyword arguments:

  *angle* = 0
    The angle of the key arrow. Measured in degrees anti-clockwise from the
    x-axis.

  *coordinates* = [ 'axes' | 'figure' | 'data' | 'inches' ]
    Coordinate system and units for *X*, *Y*: 'axes' and 'figure' are
    normalized coordinate systems with 0,0 in the lower left and 1,1
    in the upper right; 'data' are the axes data coordinates (used for
    the locations of the vectors in the quiver plot itself); 'inches'
    is position in the figure in inches, with 0,0 at the lower left
    corner.

  *color*:
    overrides face and edge colors from *Q*.

  *labelpos* = [ 'N' | 'S' | 'E' | 'W' ]
    Position the label above, below, to the right, to the left of the
    arrow, respectively.

  *labelsep*:
    Distance in inches between the arrow and the label.  Default is
    0.1

  *labelcolor*:
    defaults to default :class:`~matplotlib.text.Text` color.

  *fontproperties*:
    A dictionary with keyword arguments accepted by the
    :class:`~matplotlib.font_manager.FontProperties` initializer:
    *family*, *style*, *variant*, *size*, *weight*

Any additional keyword arguments are used to override vector
properties taken from *Q*.

The positioning of the key depends on *X*, *Y*, *coordinates*, and
*labelpos*.  If *labelpos* is 'N' or 'S', *X*, *Y* give the position
of the middle of the key arrow.  If *labelpos* is 'E', *X*, *Y*
positions the head, and if *labelpos* is 'W', *X*, *Y* positions the
tail; in either of these two cases, *X*, *Y* is somewhere in the
middle of the arrow+label key object.
上面的代码生成图如下:
[1] 官网例子


 319
319

 被折叠的 条评论
为什么被折叠?
被折叠的 条评论
为什么被折叠?
 到【灌水乐园】发言


