


图结构在计算机程序处理中是较为常用的一种数据结构,常常用来表示非欧式空间数据,处理非结构化的数据
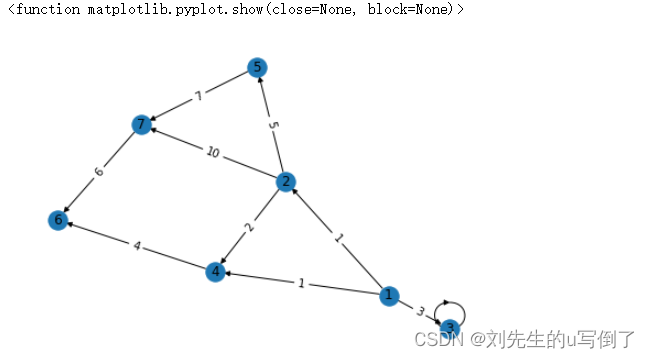
今天,用networkx实现图结构数据绘制,呈现一个有向带权图。
像了解更多使用networkx绘制图结构的方法,可以访问https://networkx.org/documentation/stable/tutorial.html,阅读相关的技术文档。
废话不多说,先祭出最终的呈现效果图:
全部实现代码:
import networkx as nx
import pandas as pd
import matplotlib.pyplot as plt
edges = pd.DataFrame()
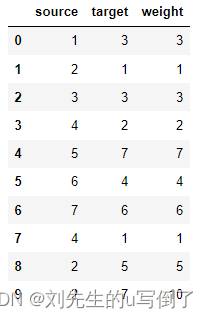
edges['source'] = [1, 2, 3, 4, 5, 6, 7, 4, 2, 2]
edges['target'] = [3, 1, 3, 2, 7, 4, 6, 1, 5, 7]
edges['weight'] = [3, 1, 3, 2, 7, 4, 6, 1, 5, 10]
# print(edges)
# nx.from_pandas_edgelist??
Graph = nx.from_pandas_edgelist(edges, source='source', target='target')
# print (Graph.nodes()) #输出全部的节点: [1, 2, 3]
Graph.add_edge(3, 1, weight=9)
# print (Graph.edges()) #输出全部的边:[(2, 3)]
# print(Graph.degree(7))
pos = nx.spring_layout(Graph)
nx.draw(Graph, with_labels=True, pos=pos, arrows=True)
dict_weight = dict()
# print(edges)
for i,e in edges.iterrows():
edge_tuple = (e[0], e[1])
dict_weight[edge_tuple] = e[2]
# print(dict_weight)
nx.draw_networkx_edge_labels(Graph, pos=pos, edge_labels=dict_weight)
plt.show
绘制的总体思路:
使用到三个库
1、pandas库,用于处理数据
2、matplotlib,用于显示画板
3、networkx,用于实现图结构并绘制边节点。
使用pandas生成边节点数据,pandas数据可以直接添加到图中
赋予边权重信息标签,必须将转换成字典形式,格式key-value对应为(起始节点,终止节点):权重
{(1, 3): 3,
 (2, 1): 1,
 (3, 3): 3,
 (4, 2): 2,
 (5, 7): 7,
 (6, 4): 4,
 (7, 6): 6,
 (4, 1): 1,
 (2, 5): 5,
 (2, 7): 10}


 1175
1175


 被折叠的 条评论
为什么被折叠?
被折叠的 条评论
为什么被折叠?
 到【灌水乐园】发言


