


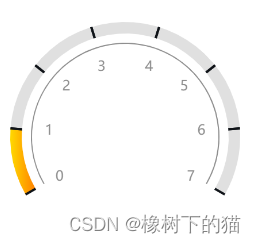
效果图:
1、项目配置echart
npm install echarts
在main.js文件内按需引入
import * as echarts from 'echarts/core'
import { TooltipComponent } from 'echarts/components'
import { GaugeChart } from 'echarts/charts'
import { CanvasRenderer } from 'echarts/renderers'

echarts.use([TooltipComponent, GaugeChart, CanvasRenderer])

Vue.prototype.$echarts = echarts
2、仪表盘的实现
<template>
  <div id="chart"></div>
</template>

<script>
export default {
  props: ['tests'],
  data () {
    return {}
  },
  watch: {
    immediate: true,
    tests (newVal) {
      this.getLoadEcharts(newVal)
    }
  },
  mounted () {
    this.getLoadEcharts(this.tests)
  },
  methods: {
    getLoadEcharts (n) {
      const chart = this.$echarts.init(document.getElementById('chart'))

      let option = {
        'series': [
          {
            'name': '',
            'type': 'gauge',
            'radius': '100%',
            'min': 0,
            'max': 7,
            'startAngle': '210',
            'endAngle': '-30',
            // 图表的刻度分隔段数
            'splitNumber': 7,
            // 图表的轴线相关
            'axisLine': {
              'show': true,
              'lineStyle': {
                'color': [
                  [
                    0.9,
                    new this.$echarts.graphic.LinearGradient(0, 0, 1, 0, [{
                      offset: 0,
                      color: '#FFD900'
                    }, {
                      offset: 1,
                      color: '#FF8000'
                    }])
                  ],
                  [1, '#e0e0e0']
                ],
                'width': 10
              }
            },
            // 图表的刻度及样式
            'axisTick': {
              'distance': -10,//远离圆心的距离
              'lineStyle': {
                'color': '#0F1318',
                'width': 2
              },
              'length': 10,
              'splitNumber': 1
            },
            // 图表的刻度标签(20、40、60等等)
            'axisLabel': {
              'distance': 10,
              'textStyle': {
                'color': '#8e8e8e'
              }
            },
            // 图表的分割线
            'splitLine': {
              'show': false
            },
            // 图表的指针
            'pointer': {
              'show': false
            },
            // 图表的数据详情
            'detail': {
              'formatter': function () {
                return ' '
              }
            },
            // 图表的标题
            'title': {
              'offsetCenter': [0, '90%'],
              'color': '#000000',
              'fontSize': 14
            },
            'data': [{
              'name': ' ',
              'value': 31
            }]
          },
          {
            'name': '外层线',
            'type': 'gauge',
            'radius': '82%',
            'startAngle': '210',
            'endAngle': '-30',
            'center': ['50%', '50%'],
            'axisLine': {
              'lineStyle': {
                'width': 1,
                'color': [[1, '#8e8e8e']]
              }
            },
            'splitLine': {
              'length': -6,
              'lineStyle': {
                'opacity': 0
              }
            },
            'axisLabel': {
              'show': false
            },
            'axisTick': {
              'splitNumber': 1,
              'lineStyle': {
                'opacity': 0
              }
            },
            'detail': {
              'show': false
            },
            'pointer': {
              'show': false
            }
          }
        ]
      }
      let tempVal = n
      if (tempVal > this.myIvstrAbility) {
        // 最后转到最终数据的地方
        option.series[0].data[0].value = this.myIvstrAbility
        option.series[0].axisLine.lineStyle.color[0][0] = this.myIvstrAbility / 7
        // 使用刚指定的配置项和数据显示图表
        chart.setOption(option)
        return
      }
      option.series[0].data[0].value = tempVal
      option.series[0].axisLine.lineStyle.color[0][0] = tempVal / 7
      // 使用刚指定的配置项和数据显示图表。
      chart.setOption(option)
      // 此处监听浏览器的resize,重新渲染图表
      let that = this
      window.addEventListener('resize', function () {
        clearTimeout(that.resizeTimer)
        that.resizeTimer = setTimeout(() => {
          chart.resize()
        }, 1000)
      })
    }
  }
}
</script>

<style scoped>
  #chart {
    width: 200px;
    height: 200px;
    display: flex;
    align-items: center;
    justify-content: center;
  }
</style>


 289
289


 被折叠的 条评论
为什么被折叠?
被折叠的 条评论
为什么被折叠?
 到【灌水乐园】发言


