


Python: cv.Rectangle(img, pt1, pt2, color, thickness=1, lineType=8, shift=0) → None
Parameters:
- img – Image.
- pt1 – Vertex of the rectangle.
- pt2 – Vertex of the rectangle opposite to pt1 .
- rec – Alternative specification of the drawn rectangle.
- color – Rectangle color or brightness (grayscale image).
- thickness – Thickness of lines that make up the rectangle. Negative values, like CV_FILLED , mean that the function has to draw a filled rectangle.
- lineType – Type of the line. See the line() description.
- shift – Number of fractional bits in the point coordinates.
The function rectangle draws a rectangle outline or a filled rectangle whose two opposite corners are pt1 and pt2, or r.tl() and r.br()-Point(1,1).
pt1 和 pt2:
如下图坐标轴,搞清楚坐标轴方向和两个点的坐标表示就好了
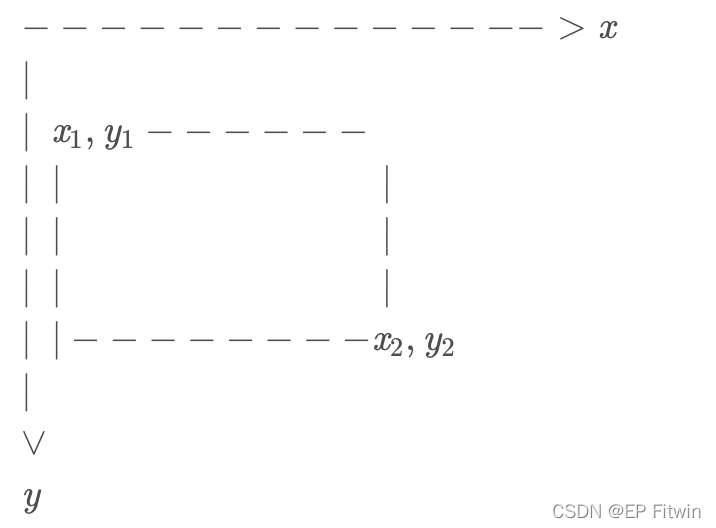
image = cv2.imread("test.png")
print(image.shape)
draw1 = cv2.rectangle(image, (200, 300), (100, 50), (0, 0, 255), 5)
cv2.imwrite("testcv2.png", draw1)
cv2.imshow("test", draw1)
color 参数
color 参数一般用 RGB 值指定,表示矩形边框的颜色。opencv中读入图片数据是按照b,g,r的顺序,所以(0,0,255)代表红色。
image = cv2.imread("test.png")
print(image.shape)
draw1 = cv2.rectangle(image, (200, 300), (100, 50), (0, 0, 255), 5)
cv2.imwrite("testcv2.png", draw1)
cv2.imshow("test", draw1)
thickness 参数
thickness 参数表示矩形边框的厚度,如果为负值,如CV_FILLED,则表示填充整个矩形。
image = cv2.imread("test.png")
print(image.shape)
draw1 = cv2.rectangle(image, (200, 300), (100, 50), (0, 0, 255), 10)
cv2.imwrite("testcv2.png", draw1)
cv2.imshow("test", draw1)


 1万+
1万+


 被折叠的 条评论
为什么被折叠?
被折叠的 条评论
为什么被折叠?
 到【灌水乐园】发言


