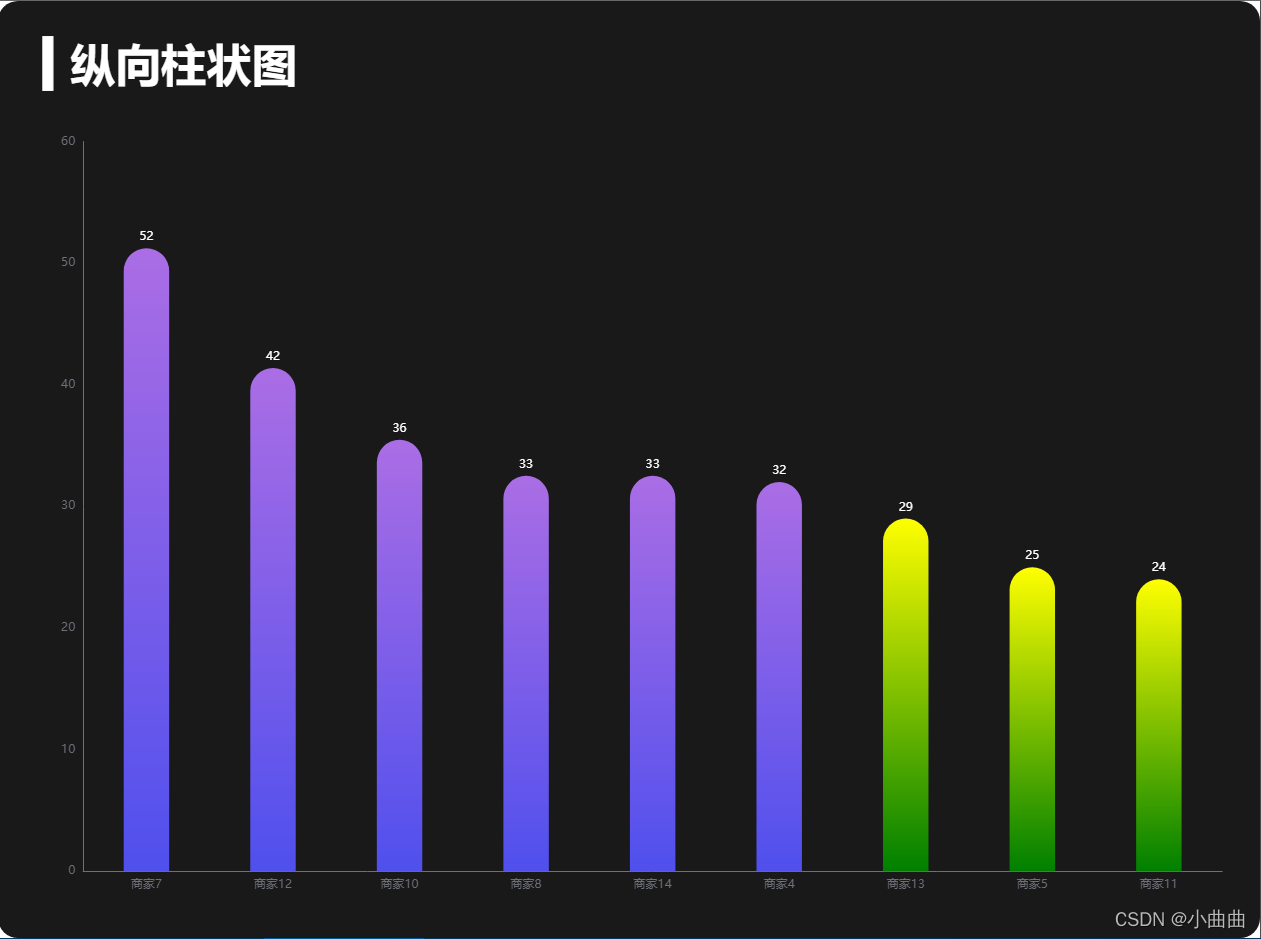
需求
- 1、对数据进行从大到小排序
- 2、不同区间的数值的柱展示不同的渐变色
- 3、每隔1S图表向左平移一个柱,同时右边新增一个柱
- 4、当鼠标移入图表停止切换,鼠标移出开启切换
<template>
<div class="w100 h100">
<div ref="bar" class="w100 h100"></div>
</div>
</template>
<script>
import { ququ } from "../../public/static/theme/ququ";
export default {
props: {
msg: String,
},
data() {
return {
barChart: null,
barData: [
{
name: "商家1",
value: 12,
},
{
name: "商家2",
value: 22,
},
{
name: "商家3",
value: 10,
},
{
name: "商家4",
value: 32,
},
{
name: "商家5",
value: 25,
},
{
name: "商家6",
value: 16,
},
{
name: "商家7",
value: 52,
},
{
name: "商家8",
value: 33,
},
{
name: "商家9",
value: 19,
},
{
name: "商家10",
value: 36,
},
{
name: "商家11",
value: 24,
},
{
name: "商家12",
value: 42,
},
{
name: "商家13",
value: 29,
},
{
name: "商家14",
value: 33,
},
],
timerId: null,
start: 0,
end: 8,
};
},
mounted() {
this.init();
this.getData();
this.openTimer();
window.addEventListener("resize", this.screenResize);
this.screenResize();
},
beforeDestroy() {
clearInterval(this.timerId);
window.removeEventListener("resize", this.screenResize);
},
methods: {
init() {
this.$echarts.registerTheme("ququ", ququ);
this.barChart = this.$echarts.init(this.$refs.bar, "ququ");
let initOption = {
title: {
text: "▍纵向柱状图",
left: 40,
top: 40,
textStyle: {
color: "#fff",
},
},
grid: {
top: "15%",
left: "5%",
right: "3%",
bottom: "5%",
containLabel: true,
},
xAxis: {
type: "category",
},
yAxis: {
type: "value",
},
series: [
{
type: "bar",
label: {
show: true,
position: "top",
color: "white",
},
itemStyle: {
color: (arg) => {
if (arg.value > 30) {
return new this.$echarts.graphic.LinearGradient(0, 1, 0, 0, [
{ offset: 0, color: "#5050ee" },
{ offset: 1, color: "#ab6ee5" },
]);
} else {
return new this.$echarts.graphic.LinearGradient(0, 1, 0, 0, [
{ offset: 0, color: "green" },
{ offset: 1, color: "yellow" },
]);
}
},
},
},
],
tooltip: {
trigger: "axis",
axisPointer: {
type: "line",
z: 0,
lineStyle: {
color: "rgba(225,225,225,.3)",
},
},
},
};
this.barChart.setOption(initOption);
this.barChart.on("mouseover", (params) => {
console.log(params);
clearInterval(this.timerId);
});
this.barChart.on("mouseout", () => {
this.openTimer();
});
},
getData() {
let list = this.barData.sort((a, b) => b.value - a.value);
let barDataX = list.map((item) => item.name);
let barDataY = list.map((item) => item.value);
let dataOption = {
xAxis: {
data: barDataX,
},
series: [
{
data: barDataY,
},
],
dataZoom: {
show: false,
startValue: this.start,
endValue: this.end,
},
};
this.barChart.setOption(dataOption);
},
openTimer() {
if (this.timerId) {
clearInterval(this.timerId);
}
this.timerId = setInterval(() => {
this.start++;
this.end++;
if (this.end > this.barData.length - 1) {
this.start = 0;
this.end = 8;
}
this.getData();
}, 1000);
},
screenResize() {
this.$nextTick(() => {
let width = this.$refs.bar.offsetWidth;
let size = (width / 100) * 3.6;
let screenOption = {
title: {
textStyle: {
fontSize: size,
},
},
series: [
{
barWidth: size,
itemStyle: {
barBorderRadius: [size / 2, size / 2, 0, 0],
},
},
],
tooltip: {
axisPointer: {
lineStyle: {
width: size,
},
},
},
};
this.barChart.setOption(screenOption);
this.barChart.resize();
});
},
},
};
</script>
<style scoped lang="less"></style>


 被折叠的 条评论
为什么被折叠?
被折叠的 条评论
为什么被折叠?
 到【灌水乐园】发言


