


 本文介绍了一种使用matplotlib库绘制双饼图的方法,并详细展示了如何设置中文标签、颜色、百分比显示等属性,以便更好地展示数据分布情况。
废话不说,先上图。这个是实际效果。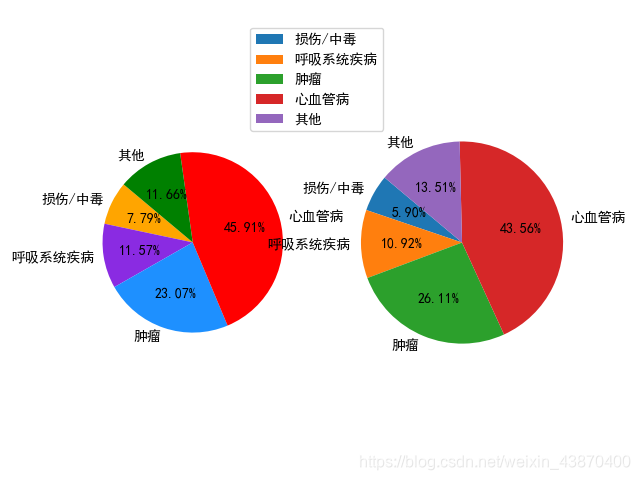
import matplotlib.pyplot as plt

plt.rcParams['font.sans-serif']=['SimHei'] #用来正常显示中文标签
# 同时绘制2个饼图
labels = [u'损伤/中毒', u'呼吸系统疾病', u'肿瘤', u'心血管病', u'其他']
sizes = [7.79, 11.57, 23.07, 45.91, 11.66]
sizes1 = [5.90, 10.92, 26.11, 43.56, 13.51]
colors = ['orange','blueviolet','dodgerblue','red','green']

# 创建四个饼图型
fig, axs = plt.subplots(1, 2)

# 第一个饼图设置
patches, l_text, p_text = axs[0].pie(sizes, labels=labels, colors=colors,
                                   labeldistance=1.1, autopct='%2.2f%%', shadow=False,
                                   startangle=140, pctdistance=0.6)

# 第二个饼图设置,设置第二个扇形偏移
patches, l_text, p_text = axs[1].pie(sizes1, labels=labels, labeldistance=1.1, autopct='%2.2f%%', shadow=False,
                                   startangle=140, pctdistance=0.6)

for t in l_text:
    t.set_size = 30
for t in p_text:
    t.set_size = 20
# 设置x,y轴刻度一致,这样饼图才能是圆的
plt.axis('equal')
plt.legend(loc='upper center', bbox_to_anchor=(-0.15, 1.1))

plt.grid()
plt.show()
fig, axs = plt.subplots(1, 2)
axs[0].pie()
axs[1].pie()
#这个是确定画几个,以及每个图具体内容的代码段
plt.subplots(1, 2)中1,2代表1行2列
plt.subplots(2, 2)
axs[0,0].pie()
axs[0,1].pie()
axs[1,0].pie()
axs[1,1].pie()
#该代码可以画2*2总共四个饼状图


 864
864

 被折叠的 条评论
为什么被折叠?
被折叠的 条评论
为什么被折叠?
 到【灌水乐园】发言


