


柱状图
使用Matplotlib提供的bar()函数来绘制柱状图
与前面介绍的plot()函数类似、程序每次调用bar()函数时都会生成一组柱状图,如果希望生成多组柱状图、则通过多次调用bar()函数来实现
bar()
bar(x, height, width=0.8, bottom=None, *, align='center', data=None, **kwargs)
主要参数:
- x:包含所有柱子的下标列表
- height:y轴的数值序列,也是柱状图的高度,一般就是我们需要展示的数据
- width:为柱状图的宽度,一般这是0.8即可
- align:柱子的对齐方式有连个可选值:cneter和edge。center表示每根柱子是根据下标来对奇的,edge则表示每根柱子全部以下表为起点,然后显示到下标的右边。如果不指定该参数,默认为center
可选参数:
- color:每根柱子呈现的颜色,可指定一个固定值或者一个列表
- edgecolor:每根柱子边框的颜色
- linewidth:每根柱子的边框宽度。如果没有设置该参数,默认无边框
- tick_label:每根柱子上显示的标签,默认无标签
- xerr:每根柱子顶部在横轴方向的线段长度
- yerr:每根柱子顶端在纵轴方向的线段长度
- ecolor:设置xerr和yerr的线段颜色,可以指定一个固定值或者一个列表
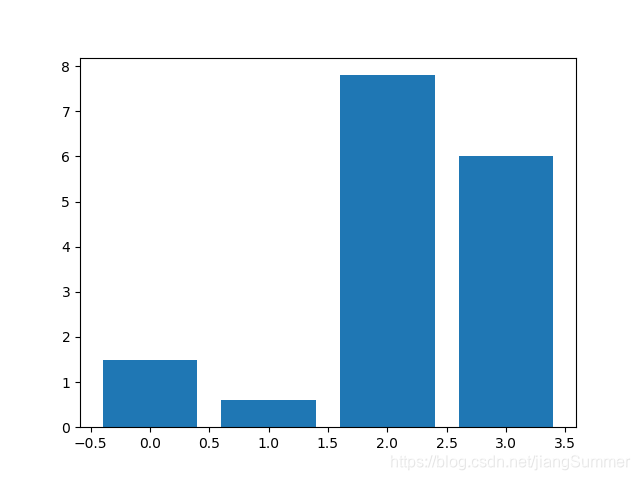
使用matplotlib绘制一个简单的柱状图
import matplotlib.pyplot as plt

num_list = [1.5,0.6,7.8,6]
plt.bar(range(len(num_list)),num_list)
plt.show()
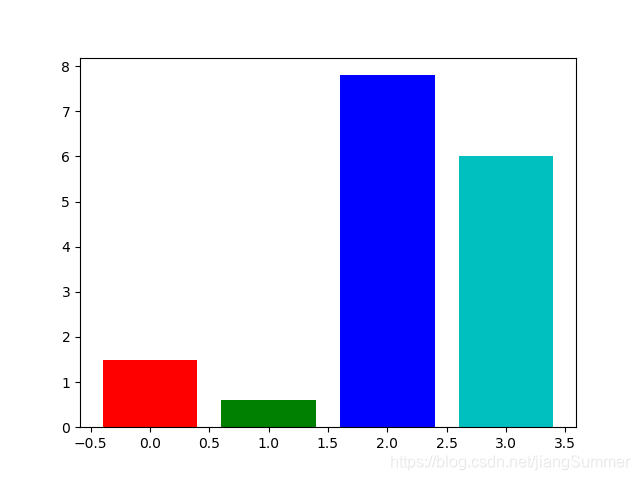
将柱子设置颜色:
import matplotlib.pyplot as plt

num_list = [1.5,0.6,7.8,6]
plt.bar(range(len(num_list)),num_list,color = 'rgbc') #红绿蓝青依次
plt.show()
设置标签
import matplotlib.pyplot as plt

name_list = ['Monday','Tuesday','Friday','Sunday']
num_list = [1.5,0.6,7.8,6]
plt.bar(range(len(num_list)),num_list,color = 'rgbc',tick_label = name_list)
plt.show()

堆叠柱状图
import matplotlib.pyplot as plt

name_list = ['Monday','Tuesday','Friday','Sunday']
num_list = [1.5,1.6,7.8,6]
num_list2 = [1,2.3,3,2]
plt.bar(range(len(num_list)),num_list, color = 'r',tick_label = name_list)
plt.bar(range(len(num_list2)),num_list2, color = 'g'
最低0.47元/天 解锁文章


 408
408


 被折叠的 条评论
为什么被折叠?
被折叠的 条评论
为什么被折叠?
 到【灌水乐园】发言


