


前言
Echarts图表在项目中经常用到,然而,重复编写初始化,更新,以及清除实例等动作对于开发人员来说是一种浪费时间和精力。因此,在这篇文章中,将封装一个 “高性能可配置Echarts组件” ,简化开发的工作流程,提高数据可视化的效率和质量。
CommonChart组件
1. 功能分析
(1)可以渲染多种类型的图表,包括折线图、柱状图、饼图、地图和散点图
(2)通过传入的 option 属性,配置图表的各种参数和样式
(4)通过传入的 onClick 属性,处理图表元素的点击事件
(5)通过传入的 notMerge 属性,控制是否合并图表配置
(6)通过传入的 lazyUpdate 属性,控制是否懒渲染图表
(7)通过传入的 style 属性,设置图表容器的样式
(8)通过传入的 className 属性,自定义图表容器的额外类名
(9)通过监听窗口大小变化,自动调整图表的大小
(10)使用 usePrevious、useWindowResize 和 useEffect 等钩子来提高组件性能并避免不必要的渲染
2. 代码+详细注释
// @/components/Echarts/commom/index.tsx
import { useRef, useEffect, CSSProperties } from "react";
// 引入 Echarts 的各种图表组件和组件配置,后续备用
import "echarts/lib/chart/line"; // 折线图
import "echarts/lib/chart/bar"; // 柱状图
import "echarts/lib/chart/pie"; // 饼图
import "echarts/lib/chart/map"; // 地图
import "echarts/lib/chart/scatter"; // 散点图
import "echarts/lib/component/tooltip"; // 提示框组件
import "echarts/lib/component/title"; // 标题组件
import "echarts/lib/component/legend"; // 图例组件
import "echarts/lib/component/markLine"; // 标线组件
import "echarts/lib/component/dataZoom"; // 数据区域缩放组件
import "echarts/lib/component/brush"; // 刷选组件
// 引入 Echarts 的类型声明
import * as echarts from "echarts";
import { ECharts, EChartOption } from "echarts";
// 引入自定义的钩子函数和公共函数
import { useWindowResize, usePrevious } from "@/hooks";
import { isDeepEqual } from "@/utils";
/**
 * 公共 Echarts 业务灵巧组件,可在项目中重复使用
 *
 * @param {Object} props - 组件属性
 * @param {EChartOption} props.option - Echarts 配置项
 * @param {Function} [props.onClick] - 点击事件处理函数
 * @param {boolean} [props.notMerge=false] - 是否不合并数据
 * @param {boolean} [props.lazyUpdate=false] - 是否懒渲染
 * @param {CSSProperties} [props.style] - 组件样式
 * @param {string} [props.className] - 组件类名
 * @returns {JSX.Element} - React 组件
 */
type Props = {
  option: EChartOption;
  onClick?: (param: echarts.CallbackDataParams) => void;
  notMerge?: boolean;
  lazyUpdate?: boolean;
  style?: CSSProperties;
  className?: string;
};
const CommonChart = (props: Props) => {
  // 解构属性,并设置默认值
  const {
    option,
    onClick, // 点击事件处理函数
    notMerge = false, // 是否不合并数据,默认为 false
    lazyUpdate = false, // 是否懒渲染,默认为 false
    style, // 组件样式
    className = "", // 组件类名,默认为空字符串
  } = props;
  // 创建 ref 来引用 div 元素,并初始化 chartInstanceRef 为 null
  const chartRef = useRef<HTMLDivElement>(null);
  const chartInstanceRef = useRef<ECharts | null>(null);
  // 使用 usePrevious 钩子函数来记录上一次的 option 和 onClick 值
  const prevOption = usePrevious(option);
  const prevClickEvent = usePrevious(onClick);

  useEffect(() => {
    // 定义一个变量来存储图表实例
    let chartInstance: ECharts | null = null;
    if (chartRef.current) {
      // 如果图表实例不存在,则初始化
      if (!chartInstanceRef.current) {
        const hasRenderInstance = echarts.getInstanceByDom(chartRef.current);
        if (hasRenderInstance) {
          hasRenderInstance.dispose();
        }
        chartInstanceRef.current = echarts.init(chartRef.current);
      }
      // 暂存当前的图表实例
      chartInstance = chartInstanceRef.current;
      // 如果 option 或 onClick 值发生变化,则重新渲染
      try {
        if (!isDeepEqual(prevOption, option, ["formatter"])) {
          chartInstance.setOption(option, { notMerge, lazyUpdate });
        }
        if (onClick && typeof onClick === "function" && onClick !== prevClickEvent) {
          chartInstance.on("click", onClick);
        }
      } catch (error) {
        chartInstance && chartInstance.dispose();
      }
    }
  }, [option, onClick, notMerge, lazyUpdate, prevOption, prevClickEvent]);
  // 监听窗口大小变化,当窗口大小变化时,重新渲染图表
  useWindowResize(() => {
    if (chartInstanceRef.current) {
      chartInstanceRef.current?.resize();
    }
  });
  return <div style={{ ...style }} className={className} ref={chartRef}></div>;
};

export { CommonChart };
3. 使用到的全局hook代码
// @/utils/index
// 深度判断两个对象某个属性的值是否相等
export const isDeepEqual = (left: any, right: any, ignoredKeys?: string[]): boolean => {
  const equal = (a: any, b: any): boolean => {
    if (a === b) return true

    if (a && b && typeof a === 'object' && typeof b === 'object') {
      if (a.constructor !== b.constructor) return false

      let length
      let i
      if (Array.isArray(a)) {
        length = a.length
        if (length !== b.length) return false
        for (i = length; i-- !== 0;) {
          if (!equal(a[i], b[i])) return false
        }
        return true
      }

      if (a instanceof Map && b instanceof Map) {
        if (a.size !== b.size) return false
        for (i of a.entries()) {
          if (!b.has(i[0])) return false
        }
        for (i of a.entries()) {
          if (!equal(i[1], b.get(i[0]))) return false
        }
        return true
      }

      if (a instanceof Set && b instanceof Set) {
        if (a.size !== b.size) return false
        for (i of a.entries()) if (!b.has(i[0])) return false
        return true
      }

      if (a.constructor === RegExp) return a.source === b.source && a.flags === b.flags
      if (a.valueOf !== Object.prototype.valueOf) return a.valueOf() === b.valueOf()
      if (a.toString !== Object.prototype.toString) return a.toString() === b.toString()

      const keys = Object.keys(a)
      length = keys.length
      if (length !== Object.keys(b).length) return false

      for (i = length; i-- !== 0;) {
        if (!Object.prototype.hasOwnProperty.call(b, keys[i])) return false
      }

      for (i = length; i-- !== 0;) {
        const key = keys[i]

        if (key === '_owner' && a.$$typeof) {
          // React
          continue
        }

        if (ignoredKeys && ignoredKeys.includes(key)) {
          continue
        }

        if (!equal(a[key], b[key])) return false
      }

      return true
    }
    // eslint-disable-next-line no-self-compare
    return a !== a && b !== b
  }
  return equal(left, right)
}
--------------------------------------------------------------------------
// @/hooks/index.ts
/**
 * Returns the value of the argument from the previous render
 * @param {T} value
 * @returns {T | undefined} previous value
 * @see https://react-hooks-library.vercel.app/core/usePrevious
 */
export function usePrevious<T>(value: T): T | undefined {
  const ref = useRef<T>()

  useEffect(() => {
    ref.current = value
  }, [value])

  return ref.current
}

export function useWindowResize(callback: (event: UIEvent) => void) {
  useEffect(() => {
    window.addEventListener('resize', callback)
    return () => window.removeEventListener('resize', callback)
  }, [callback])
}
4. 使用方式
// 引入组件和echarts
import { CommonChart } from "@/components/Echarts/common";
import echarts from "echarts/lib/echarts";
// 使用
const useOption = () => {
return (data: any): echarts.EChartOption => {
return {
color: ["#ffffff"],
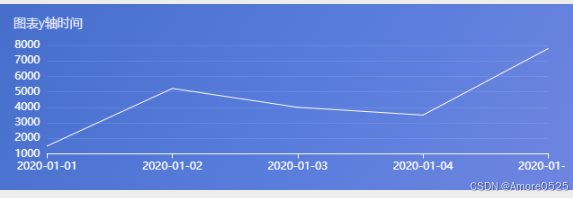
title: {
text: "图表y轴时间",
textAlign: "left",
textStyle: {
color: "#ffffff",
fontSize: 12,
fontWeight: "lighter",
fontFamily: "Lato",
},
},
grid: {
left: "2%",
right: "3%",
top: "15%",
bottom: "2%",
containLabel: true,
},
xAxis: [
{
axisLine: {
lineStyle: {
color: "#ffffff",
width: 1,
},
},
data: data.map((item: any) => item.xTime),
axisLabel: {
formatter: (value: string) => value,
},
boundaryGap: false,
},
],
yAxis: [
{
position: "left",
type: "value",
scale: true,
axisLine: {
lineStyle: {
color: "#ffffff",
width: 1,
},
},
splitLine: {
lineStyle: {
color: "#ffffff",
width: 0.5,
opacity: 0.2,
},
},
axisLabel: {
formatter: (value: string) => new BigNumber(value),
},
boundaryGap: ["5%", "2%"],
},
{
position: "right",
type: "value",
axisLine: {
lineStyle: {
color: "#ffffff",
width: 1,
},
},
},
],
series: [
{
name: t("block.hash_rate"),
type: "line",
yAxisIndex: 0,
lineStyle: {
color: "#ffffff",
width: 1,
},
symbol: "none",
data: data.map((item: any) => new BigNumber(item.yValue).toNumber()),
},
],
};
};
};
const echartData = [
{ xTime: "2020-01-01", yValue: "1500" },
{ xTime: "2020-01-02", yValue: "5220" },
{ xTime: "2020-01-03", yValue: "4000" },
{ xTime: "2020-01-04", yValue: "3500" },
{ xTime: "2020-01-05", yValue: "7800" },
];
const parseOption = useOption();
<CommonChart
option={parseOption(echartData, true)}
notMerge
lazyUpdate
style={{
height: "180px",
}}
></ChartBlock>
5. 效果展示
总结
下一篇讲【首页响应式搭建以及真实数据渲染】。关注本栏目,将实时更新。


 4918
4918


 被折叠的 条评论
为什么被折叠?
被折叠的 条评论
为什么被折叠?
 到【灌水乐园】发言


