


软件包软件包下载:
1.准备工作:
2.安装logstash
解压后是没有logstash的配置文件的,需要手动创建一个,上面截图的log.conf就是我手动创建的,为了测试,只是配置了简单的标准输入和标准输出,内容如下:
尝试启动logstash并验证是否配置成功,在logstash的解压目录下执行命令: ./bin/logstash -f config/log.conf,出现如下截图表明配置成功,从启动信息中也能看出日志路径,端口等信息
在交互里随便输入测试hello log,看看输出吧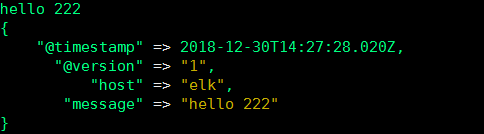
3.安装elasticsearch
编辑elasticsearch.yml
编辑/etc/security/limits.conf文件,新增以下内容
elasticsearch不可用root用户启动,切换到elasticsearch用户运行:
查看端口监听信息: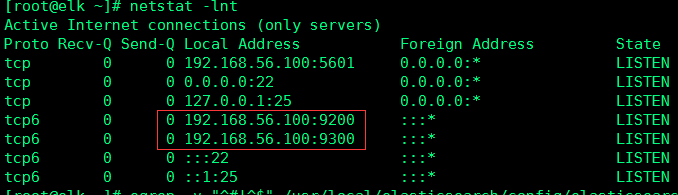
在浏览器中查看: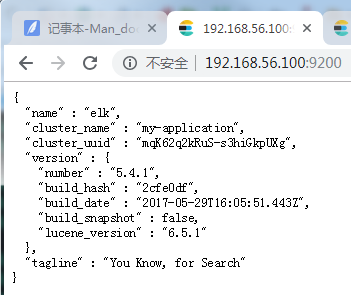
完成logstash和elasticsearch的安装后,就该开始集成他们俩了,回到logstash的配置文件log.conf,修改配置如下:输入还是标准输入,输出增添一个elasticsearch,hosts配置elasticsearch的地址和端口:
在启动logstash过程中检查并连接output端elasticsearch,输入测试字符串后,访问elasticsearch的api: http://192.168.56.100:9200/logstash-test/_search(logstash-test是logstash.conf中配置的索引index),可以看到如下:刚才输入的I hello 222已经在elasticsearch中可以查看到了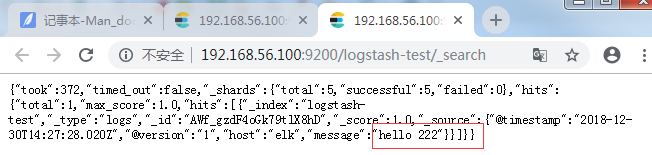
4.安装kibana
进入kibana的解压目录的config目录下,编辑kibana.yml,server.port:5601放开,server.host修改为kibana的安装服务器,配置elasticsearch的路径端口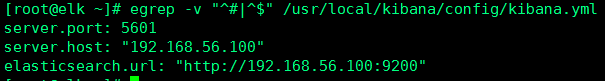
启动:/bin/kibana & 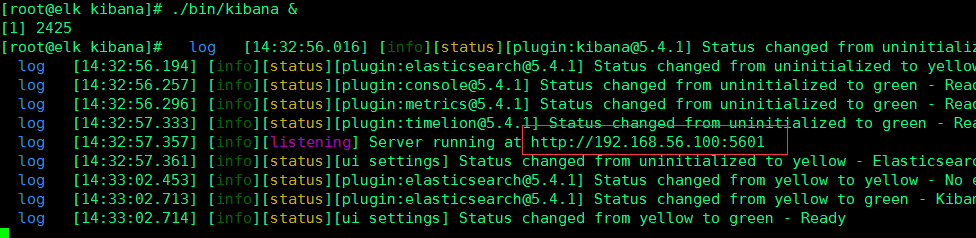
再在logstash的交互中输入:Hello kaka,you are the chen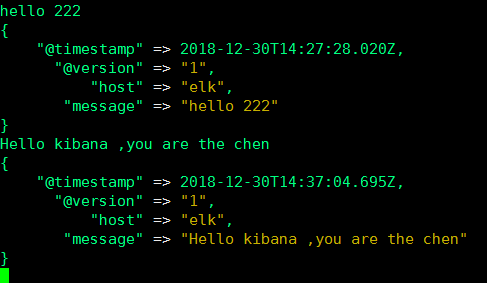
网页可以看见: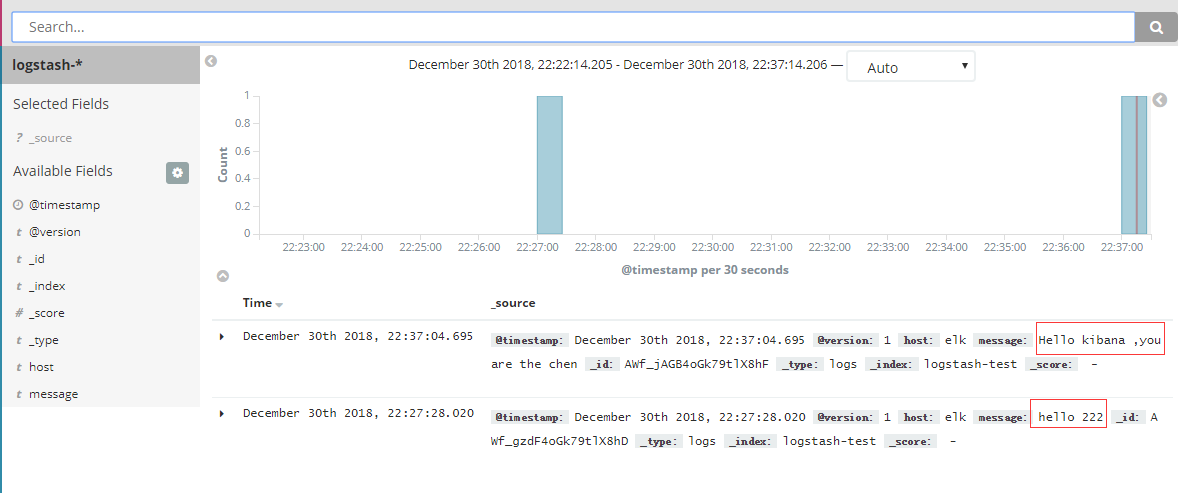
5.接下来安装redis:
我需要的是centos 64位,我直接找到源后wget下载到当前目录:wget http://dl.fedoraproject.org/pub/epel/6/x86_64/epel-release-6-8.noarch.rpm
然后进行安装:rpm -ivh epel-release-6-8.noarch.rpm
第三、安装redisyum install redis
在配置文件中配置:vi /etc/redis.conf
启动redis-serverredis-server /etc/redis.conf
redis和ELK还没有对接成功,后面待更新!!!


 358
358

 被折叠的 条评论
为什么被折叠?
被折叠的 条评论
为什么被折叠?
 到【灌水乐园】发言


