


数据导入和处理
#数据导入和处理
import numpy as np
from pyecharts import options as opts #用以设置
from pyecharts.charts import Radar #导入雷达类
import pandas as pd #导入数据分析模块
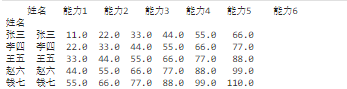
d1=pd.read_excel(r"./excel/雷达图.xlsx",sheet_name='Sheet1') #读取数据
data_next=d1
for k in range(1,7):
data_next[f'能力{k}']=data_next[f'能力{k}']*11
#需要转换数据类型,不转换可能导致雷达图数据显示NaN
data_next[f'能力{k}']=data_next[f'能力{k}'].astype('float')
data_next.index=d1['姓名']
print(data_next)
雷达图配置
#雷达图自定义函数
def radar(data_next):
    #原始数据
    test_data=data_next.loc[:,['能力1','能力2','能力3','能力4','能力5','能力6']]
    #维度名称
    weidu=list(test_data.columns)
    print(weidu)
    #图例名称
    names=list(test_data.index)
    #处理完数组数据
    weidu_data=np.array(test_data.iloc[:,:])
    radar_color=['#5383FF','#FFC75C','#F3775E','#74D8C9','#AC88FD']
# c_schema  以字典形式存储指标名称和范围   取每个字段最大值  作为最大范围。
    c_schema=[]
    for i in range(len(weidu)):
        max_=round(not_zero(max(test_data.iloc[:,i]))*,2)
        print(max_)
        c_schema.append({'name':weidu[i],'max':max_,'min':0,'color':'black'})
    print(c_schema)

    radar=Radar(init_opts=opts.InitOpts(bg_color = 'black'))
    for j in range(len(names)):
        print(list(weidu_data[j]),str(names[j]),radar_color[j])
        radar.add(str(names[j]),[list(weidu_data[j])],color=radar_color[j],areastyle_opts=opts.AreaStyleOpts(opacity=0.2)) #添加数据并绘图
    radar.add_schema(schema=c_schema,shape="circle",textstyle_opts=opts.TextStyleOpts(font_size=16),center=['30%', '45%']) #schema设置  #  polygon 多边形 circle 圆形
    radar.set_series_opts(label_opts=opts.LabelOpts(is_show=True)) #标签设置
    radar.set_global_opts(title_opts=opts.TitleOpts(title="六维度雷达图"),#标题设置
                         legend_opts=opts.LegendOpts(pos_bottom=0,pos_left='35%'))#图例设置
    radar.render("./picture/六维度雷达图.html")

就这样六边形战士钱7就出现了。
出现的问题
1.c_schema要和weidu_data数据类型要相同,不然雷达图数据虽然导入进去显示也为NaN,图形也无法显示。
2.标签数据为数字的,记得转为字符串,否则显示不出来。


 1244
1244


 被折叠的 条评论
为什么被折叠?
被折叠的 条评论
为什么被折叠?
 到【灌水乐园】发言


