


参考原文:
- http://blog.itaysk.com/2020/04/20/ebpf-lost-events
本文内容基本翻译于上面的链接
一、什么是eBPF lost events
我们都知道bpf运行在内核态,bpc也提供了多种内核态与用户态交互的方式,例如:
- bpf_trace_printk(),利用
/sys/kernel/debug/tracing/trace_pipe这个debug文件 - BPF_PERF_OUTPUT,基于perf子系统原有的数据传递方式
不过官方还是推荐第二种方式,主要原因在于第一种的限制较多:3 args max, 1 %s only, and trace_pipe is globally shared
所以我们需要先了解一下perf这个先于bpf诞生的分析工具提供的ring buffer机制(bpf也是利用了此机制)
Ring buffer:
ring buffer是一个连续的内存区域,生产者和消费者能够同时在其中读写,ring的原因在于即使环形缓冲区满了,写入方还是可以继续从首部写入即使覆盖了原本的数据

由此也不难知晓lost event的意义:当消费者来不及消费旧事件时,新的事件已经被写入者追赶上写入而导致事件未被消费就被覆盖或者说lost event
二、tracing the code
追踪bcc中的perf ring buffer的整个过程来更好的理解
如果使用python前端来写bcc,那么基本两个步骤就是:
- Initialize buffer using the
BPF.open_perf_buffermethod - Start receiving events using
BPF.perf_buffer_pollmethod
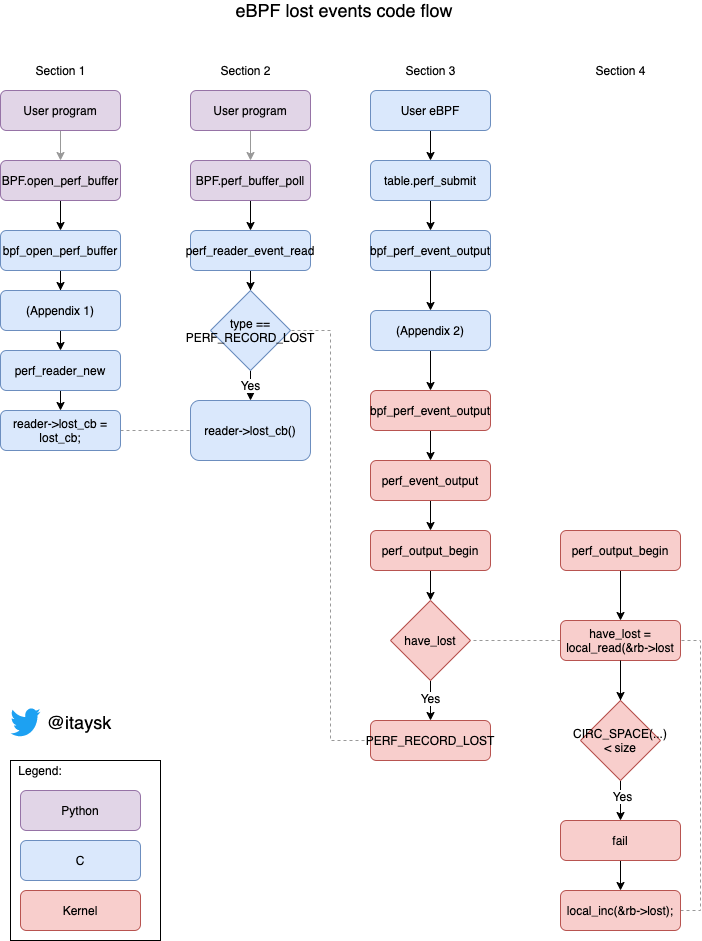
Section 1 - BPF.open_perf_buffer
-
The user program is opening a perf buffer using the
BPF.open_perf_buffermethod which receives alost_cbcallback (function pointer): (source)使用
open_perf_buffer函数会接受一个lost_cb的回调函数def open_perf_buffer(self, callback, page_cnt=8, lost_cb=None) -
BPF.open_perf_bufferends up creating a “reader” using theperf_reader_newC function. “reader” is a bcc construct that facilitates reading from a buffer. Appendix 1 walks through this code path.BPF.open_perf_buffer会创建一个reader用于读取ring buffer -
perf_reader_newC function is saving the callback in the newly created reader: (source)perf_reader_new函数会在reader中保存回调函数reader->lost_cb = lost_cb;
所以在一开始我们就需要将回调函数传递,随后会保存在创建的reader中(用于读取ring buffer)
Section 2 - BPF.perf_buffer_poll
-
The user program is calling
BPF.perf_buffer_pollmethod to start receiving events. This is using bcc’s C functionperf_reader_pollto read from the previously created “reader”: (source)使用
BPF.perf_buffer_poll从reader中读取数据lib.perf_reader_poll(len(readers), readers, timeout) -
perf_reader_pollis invoking the read function on every reader: (source) 在每个reader上调用read
perf_reader_event_read(readers[i]);
-
perf_reader_event_readis reading an event. If it’s type isPERF_RECORD_LOST, it will call our lost events callback: (source)如果读出的事件类型是
PERF_RECORD_LOST,那么就会调用我们的回调函数if (e->type == PERF_RECORD_LOST) { ... reader->lost_cb(reader->cb_cookie, lost); ... }
所以,当从ring bufffer中读出的事件类型是PERF_RECORD_LOST就会调用我们预先设置的回调函数,但是我们没有submit这个类型的事件,它是怎么发生的呢?
Section 3 - perf_submit
To submit events from our eBPF © program, we are instructed to initialize a “table” using the BPF_PERF_OUTPUT macro, and then call the perf_submit bcc C helper function.
为了模拟perf_submit,我们创建了table
-
The user eBPF program is using
BPF_PERF_OUTPUTto define a struct. The created struct holds a pointer to theperf_submitfunction: (source:) -
The user eBPF program calls
table.perf_submit()to submit an event -
bpf_perf_event_outputends up callingperf_event_outputfunction from the perf subsystem. Appendix 2 walks through this code path.table.perf_submit最终会调用perf子系统的perf_event_output函数,向ring buffer写入
-
perf_event_outputcallsperf_output_beginfunction before it actually submits an event. (source) -
perf_output_beginkernel function is the one that creates the “lost events”: (source)struct { struct perf_event_header header; u64 id; u64 lost; } lost_event;
perf_output_begin最终在实际提交event之前会检查和创建lost event :
if (unlikely(have_lost)) { … lost_event.header.type = PERF_RECORD_LOST; … }
What is this have_lost indicator? Let’s dig (final stretch, bear with me)
关键的判断指标hava_lost是如何工作的呢?
Section 4 - Tracking the ring buffer’s have_lost indicator
If we look at the perf_output_begin function from the kernel’s perf ring buffer implementation:
-
have_lostvariable is holding the ring buffer’slostfield: (source)have_lost变量保存了环形缓冲区的lost字段:have_lost = local_read(&rb->lost); -
There’s a check if there’s enough space in the ring buffer (and also the buffer is configured to not overwrite), then we go to
fail: (source)if (!rb->overwrite && unlikely(CIRC_SPACE(head, tail, perf_data_size(rb)) < size)) goto fail;会检查如果ring buffer已经满了或者被配置超越某个大小,那么就直接失败
-
Under
fail,rb->lostis being incremented: (source) 在fail的实现中就是标记lost发生了,+1fail: local_inc(&rb->lost);
不难想象,发生lost event的原因就是写入时已满/达到最大容量修改flag,然后读取方进行了判断,如果是lost event类型,那么就会执行对应的callback函数
总体流程如下:
三、Lost events in gobpf
如何在gobpf中使用lost event?作者已经在提交了issue:https://github.com/iovisor/gobpf/pull/235. (已合并)
重点的改变在于:
-
change
callbackDatastruct to contain a lost channel in addition to the main channel:在
callbackData中除了主通道之外创建lostChancallbackDataIndex := registerCallback(&callbackData{ receiverChan, lostChan, }) -
change the signature of the
InitPerfMapuser facing function making it also accept a channel for lost events:func InitPerfMap(table *Table, receiverChan chan []byte, lostChan chan uint64) (*PerfMap, error) {...} -
in the call to the lower level bcc C function
bpf_open_perf_buffer, pass the registered lost callback:reader, err := C.bpf_open_perf_buffer( (C.perf_reader_raw_cb)(unsafe.Pointer(C.rawCallback)), (C.perf_reader_lost_cb)(unsafe.Pointer(C.lostCallback)), unsafe.Pointer(uintptr(callbackDataIndex)), -1, cpuC, pageCntC)
四、Appendix
拓展阅读:https://www.kernel.org/doc/Documentation/circular-buffers.txt
Appendix 1 - from BPF.open_perf_buffer to perf_reader_new
BPF.open_perf_buffermethod is calling into bcc’s C functionlib.bpf_open_perf_buffer(source)bpf_open_perf_bufferfunction is creating a reader usingperf_reader_newfunction (source)
Appendix 2 - from bpf_perf_event_output to perf_event_output
table.perf_submit()function is converted tobpf_perf_event_output()(source)bpf_perf_event_outputis implemented byBPF_FUNC_perf_event_output(source)BPF_FUNC_perf_event_outputis an eBPF helper: (source)BPF_FUNC_perf_event_outputis creating thebpf_perf_event_outputprototype:bpf_perf_event_output_proto: (source)bpf_perf_event_output_protois pointing to thebpf_perf_event_outputfunction (source)bpf_perf_event_outputfunction is calling theperf_event_outputfunction [(source)](


 1862
1862


 被折叠的 条评论
为什么被折叠?
被折叠的 条评论
为什么被折叠?
 到【灌水乐园】发言


