import pandas as pd
import matplotlib.pyplot as plt
from matplotlib.patches import Rectangle
data=pd.read_csv(r'D:\temp\工作簿2.csv',encoding='utf-8')
prohibitedCount=1
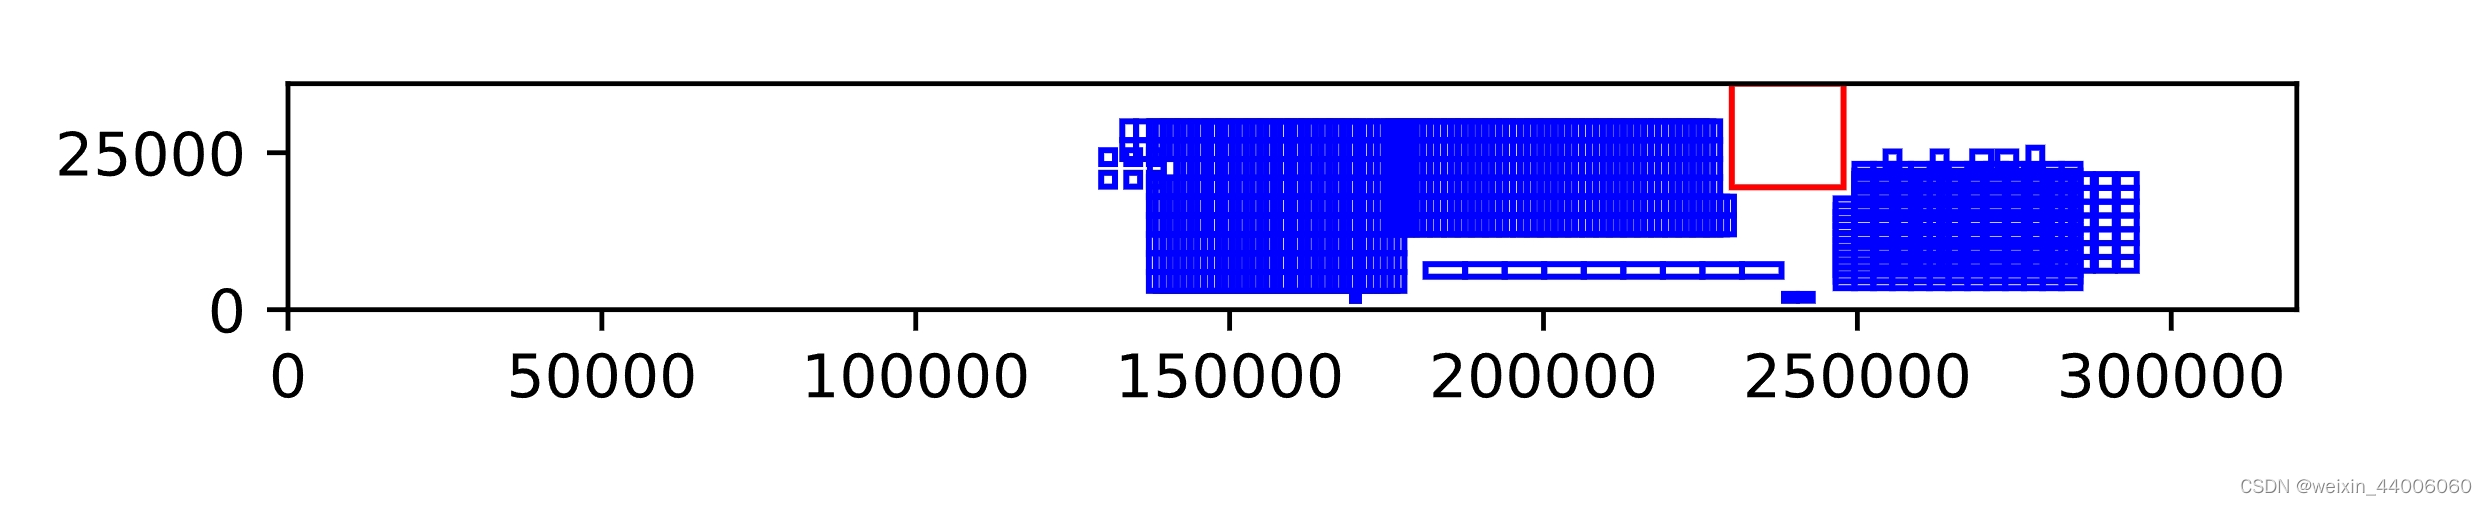
fig, ax = plt.subplots()
x=[]
for index, row in data.iterrows():
left_bottom = (row['addr_x_fr'], row['addr_y_fr'])
right_top = (row['addr_x_to'], row['addr_y_to'])
x.append(index)
width = right_top[0] - left_bottom[0]
height = right_top[1] - left_bottom[1]
if index<=len(data)-prohibitedCount-1:
rect = Rectangle(left_bottom, width, height, linewidth=1, edgecolor='blue', facecolor='none')
else:
rect = Rectangle(left_bottom, width, height, linewidth=1, edgecolor='r', facecolor='none')
ax.add_patch(rect)
ax.set_xlim(0, 320000)
ax.set_ylim(0, 36000)
ax.set_aspect('equal')
plt.savefig('rectangles_2.svg', format='svg')
plt.show()


 被折叠的 条评论
为什么被折叠?
被折叠的 条评论
为什么被折叠?
 到【灌水乐园】发言


