


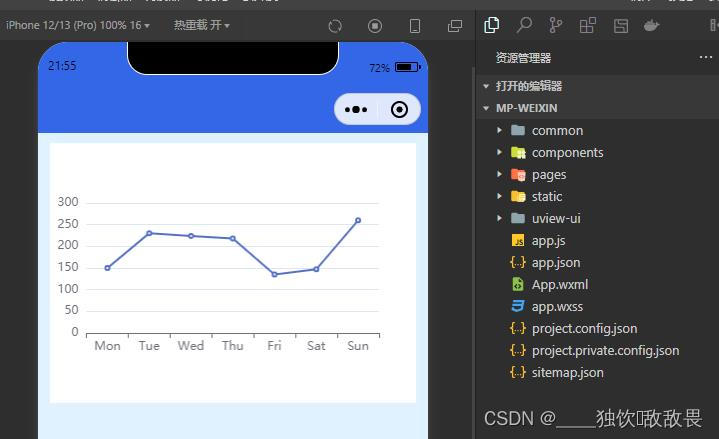
效果图:
需要的两个主要文件就是 echarts.min.js 和 echarts.vue
1、echarts.min.js 可以去官网定制 链接 ECharts 在线构建 或者直接去GitHub - Tawesome666/echarts: echarts 下载
(注意:我这个只有柱状图和折线图)
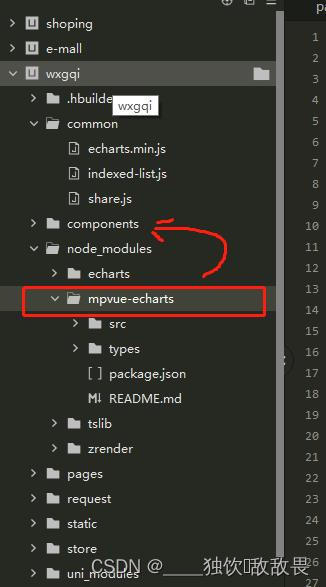
2、echarts.vue 可以使用 Visual Studio Code 打开你的文件夹使用命令 npm install echarts mpvue-echarts 执行完了后在node-module 把mpvue-echarts 中 src 文件夹复制到 components 文件夹下
3、上代码 这个是没与后端交互的 第四点是与后端交互的代码 (不与后端交互的可以直接扣下面代码就有效果了)
<template>
	<view>
		<view class="box1">
			<my-echarts id="main" ref="mapChart" :echarts="echarts" :onInit="init" />
		</view>
	</view>
</template>

<script>
	import * as echarts from '../../common/echarts.min.js';
	import myEcharts from '@/components/mpvue-echarts/src/echarts.vue';
	export default {
		data() {
			return {

			}
		},
		components:{
			myEcharts
		},
		methods: {
			init(canvas, width, height) {
				let chart = null
				chart = echarts.init(canvas, null, {
					width: width,
					height: height
				});
				let option = {
					xAxis: {
						type: 'category',
						data: ['Mon', 'Tue', 'Wed', 'Thu', 'Fri', 'Sat', 'Sun']
					},
					yAxis: {
						type: 'value'
					},
					series: [{
						data: [150, 230, 224, 218, 135, 147, 260],
						type: 'line'
					}]
				};
				chart.setOption(option);
				return chart; // 返回 chart 后可以自动绑定触摸操作
			},
        }
	}
</script>


<style lang="scss">
	.box1 {
		width: 94%;
		height: 500rpx;
		background-color: #fff;
		margin: 10px auto;
	}
</style>
4、与后端交互的代码 主要实现就是在这个 init函数 内执行请求
<template>
	<view>
		<view class="box1">
			<my-echarts id="main" ref="mapChart" :echarts="echarts" :onInit="init" />
		</view>
	</view>
</template>


<script>
    import * as echarts from '../../common/echarts.min.js';
	import myEcharts from '@/components/mpvue-echarts/src/echarts.vue';
    export default {
		data() {
			return {
				Xdata:[],
				Ydata:[]
			}
		},
		components:{
			myEcharts
		},
		methods: {
			init(canvas, width, height) {
				const echarr = []
				const waringnum = []
				this.$myHttp({ 					//与后端请求
					url: WarnLineGraph,
					method: "GET",
				}).then(res => {
					let arr = res.data.data
					arr.forEach(item => {
						echarr.push(item.warningTime)
						waringnum.push(item.warningNum)
					})
					this.Xdata = echarr
					this.Ydata = waringnum

					let chart = null
					chart = echarts.init(canvas, null, {
						width: width,
						height: height
					});
					let option = {
						xAxis: {
							type: 'category',
							data: this.Xdata,    //后端的数据
							axisTick: {
								//y轴刻度线
								show: false,
							},
							// "axisLabel": {
							// 	"interval": 0,
							// 	"rotate": 30
							// },
						},
						yAxis: [{
							type: 'value',
							axisTick: {
								show: false, //去除y轴刻度线
							},
						}, ],
						series: [{
							data:this.Ydata,   //后端的数据
							type: 'line',
							symbolSize: 6, // 圆点大小
							itemStyle: {
								// 线条样式
								normal: {
									color: "#0080ff",
									lineStyle: {
										color: "#0080ff",
									},
								},
							},
						}],

					};
					chart.setOption(option);
					return chart; // 返回 chart 后可以自动绑定触摸操作
				})
			},
		}
	}

</script>


<style lang="scss">
	.box1 {
		width: 94%;
		height: 500rpx;
		background-color: #fff;
		margin: 10px auto;
	}
</style>
5、报错处理
遇到 this.echarts.setCanvasCreator is not a function 报错
遇到 t.addEventListener is not a function 报错
去参照这位博主 它上面讲的很详细 uni-app微信小程序使用ECharts_柚大大的博客-CSDN博客_uni-app 使用echarts
写了蛮长的点个赞走呗 !亲爱的!!!


 4410
4410


 被折叠的 条评论
为什么被折叠?
被折叠的 条评论
为什么被折叠?
 到【灌水乐园】发言


