


1. 导入库
import matplotlib.pyplot as plt
import numpy as np
2. 基础线图
绘制简单的线图并添加轴标签、标题和图例。
x = np.linspace(0, 10, 100)
y = np.sin(x)

plt.plot(x, y, label='sin(x)')
plt.xlabel('X Axis')
plt.ylabel('Y Axis')
plt.title('Sine Wave')
plt.legend()
plt.show()
3. 多个子图
你可以在同一图形窗口中绘制多个子图。
plt.subplot(2, 1, 1)
plt.plot(x, y)
plt.title('Sine Wave')

plt.subplot(2, 1, 2)
plt.plot(x, np.cos(x))
plt.title('Cosine Wave')

plt.tight_layout()
plt.show()
4. 散点图
plt.scatter(x, y, c='red', marker='o')
plt.xlabel('X Axis')
plt.ylabel('Y Axis')
plt.title('Scatter Plot')
plt.show()
5. 直方图
data = np.random.randn(1000)
plt.hist(data, bins=20)
plt.title('Histogram')
plt.xlabel('Value')
plt.ylabel('Frequency')
plt.show()
6. 3D图
from mpl_toolkits.mplot3d import Axes3D

x = np.linspace(-5, 5, 100)
y = np.linspace(-5, 5, 100)
x, y = np.meshgrid(x, y)
z = np.sin(np.sqrt(x**2 + y**2))

fig = plt.figure()
ax = fig.add_subplot(111, projection='3d')
ax.plot_surface(x, y, z, cmap='viridis')
plt.title('3D Surface Plot')
plt.show()
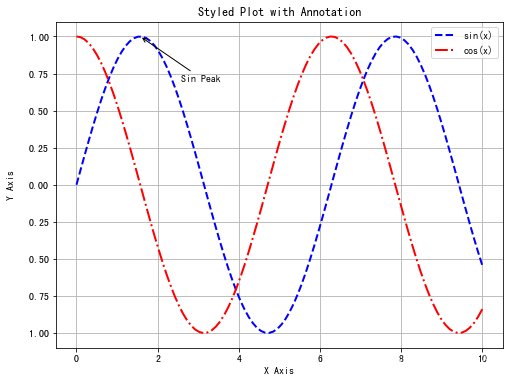
7. 自定义图例、注释和样式
plt.plot(x, y, label='sin(x)', color='red', linestyle='dashed', linewidth=2)
plt.xlabel('X Axis')
plt.ylabel('Y Axis')
plt.title('Custom Style')
plt.legend(loc='upper right')
plt.annotate('Peak', xy=(1.57, 1), xytext=(2, 1), arrowprops=dict(facecolor='black'))
plt.grid(True)
plt.show()
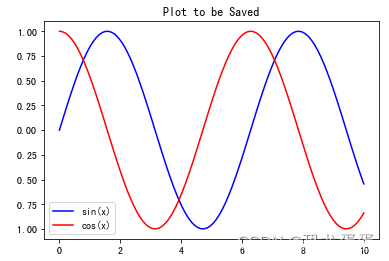
8. 保存图形
要将图形保存为文件,你可以使用plt.savefig。
plt.plot(x, y)
plt.title('Save This Plot')
plt.savefig('plot.png')
结论
Matplotlib提供了许多功能和自定义选项,以便你可以准确地创建所需的图形。其语法灵活且强大,允许从简单的线图到复杂的3D可视化。Matplotlib的官方文档和在线社区支持非常丰富,可以帮助你深入了解所有可用的功能和选项。


 1747
1747


 被折叠的 条评论
为什么被折叠?
被折叠的 条评论
为什么被折叠?
 到【灌水乐园】发言


