


概率图模型(probabilistic graphical model)是一类用图来表达变量相关关系的概率模型。
第一类是使用有向无环图表示变量间的依赖关系,称为有向图模型或贝叶斯网(Bayesian network);
第二类是使用无向图表示变量间的相关关系,称为无向图模型或马尔可夫网(Markovnetwork)。
1、术语
隐马尔可夫模型(Hidden Markov Model,简称HMM) 是结构最筒单的动态贝叶斯网(dynamic Bayesian network) ,著名的有向图模型。
马尔可夫随机场(Markov Random Field,简称MRF)是典型的马尔可夫网,这是一种著名的无向图模型。
条件随机场(Conditional Random Field,简称CRF) 是一种判别式无向图模型。
话题模型(topic model)是一族生成式有向图模型,主要用于处理离散型的数据(如文本集合) ,在信息检索、自然语言处理等领域有广泛应用。隐狄利克雷分配模型(Latent Dirichlet Allocation,简称LDA) 是话题模型的典型代表。
2、Sklearn代码实现
示例:隐狄利克雷分配模型(Latent Dirichlet Allocation,简称LDA)话题模型
import jieba
import matplotlib.pyplot as plt
from sklearn.feature_extraction.text import CountVectorizer
from sklearn.decomposition import LatentDirichletAllocation

n_features = 1000
n_components = 10
n_top_words = 10


def main_lda():
    # 加载数据
    with open(r'./lda_test.txt', mode='r', encoding='utf-8') as f:
        txt = f.read()
        # print(txt)  朱自清-荷塘月色(部分段落)

    # 中文分词
    data = jieba.lcut(txt)
    # word_list = [word for word in jieba.cut(txt)]
    # print(data)
    # 停用词,为了示意随便写了几个词,建议使用公开的词表
    stop_list = set('的 是 个 上 大 不 : ? ? 有 , 。 一个'.split())
    # Use tf (raw term count) features for LDA
    tf_vectorizer = CountVectorizer(max_df=0.95, min_df=2, max_features=n_features, stop_words=stop_list)
    tf_data = tf_vectorizer.fit_transform(data)
    # print(tf_data)
    # 创建模型
    lda = LatentDirichletAllocation(n_components=n_components, max_iter=50,
                                    learning_method='online',
                                    learning_offset=50.,
                                    random_state=7)
    lda.fit(tf_data)
    tf_feature_names = tf_vectorizer.get_feature_names()
    plot_top_words(lda, tf_feature_names, 'Topics in LDA model')


# 绘图方法摘自sklearn官方示例
def plot_top_words(model, feature_names, title):
    fig, axes = plt.subplots(2, 5, figsize=(30, 15), sharex=True)
    axes = axes.flatten()
    for topic_idx, topic in enumerate(model.components_):
        top_features_ind = topic.argsort()[:-n_top_words - 1:-1]
        top_features = [feature_names[i] for i in top_features_ind]
        weights = topic[top_features_ind]

        ax = axes[topic_idx]
        ax.barh(top_features, weights, height=0.7)
        ax.set_title(f'Topic {topic_idx +1}', fontdict={'fontsize': 20})
        ax.invert_yaxis()
        ax.tick_params(axis='both', which='major', labelsize=14)
        for i in 'top right left'.split():
            ax.spines[i].set_visible(False)
        fig.suptitle(title, fontsize=20)

    plt.subplots_adjust(top=0.90, bottom=0.05, wspace=0.90, hspace=0.3)
    plt.show()


if __name__ == '__main__':
    import matplotlib as mpl
    # 汉字字体,优先使用楷体,如果找不到楷体,则使用黑体
    mpl.rcParams['font.sans-serif'] = ['SimHei', 'KaiTi', 'FangSong']

    main_lda()
运行结果,如下:
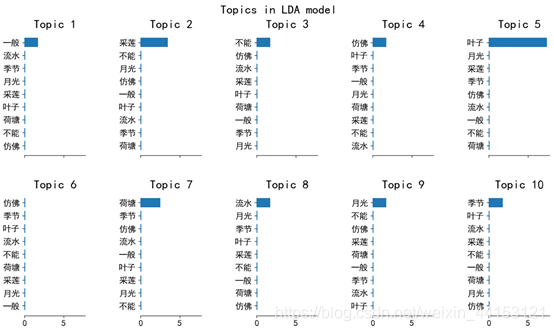
感觉主题挺乱的


 477
477


 被折叠的 条评论
为什么被折叠?
被折叠的 条评论
为什么被折叠?
 到【灌水乐园】发言


