


python 无法正常显示xlabel / ylabel
如上述所示,
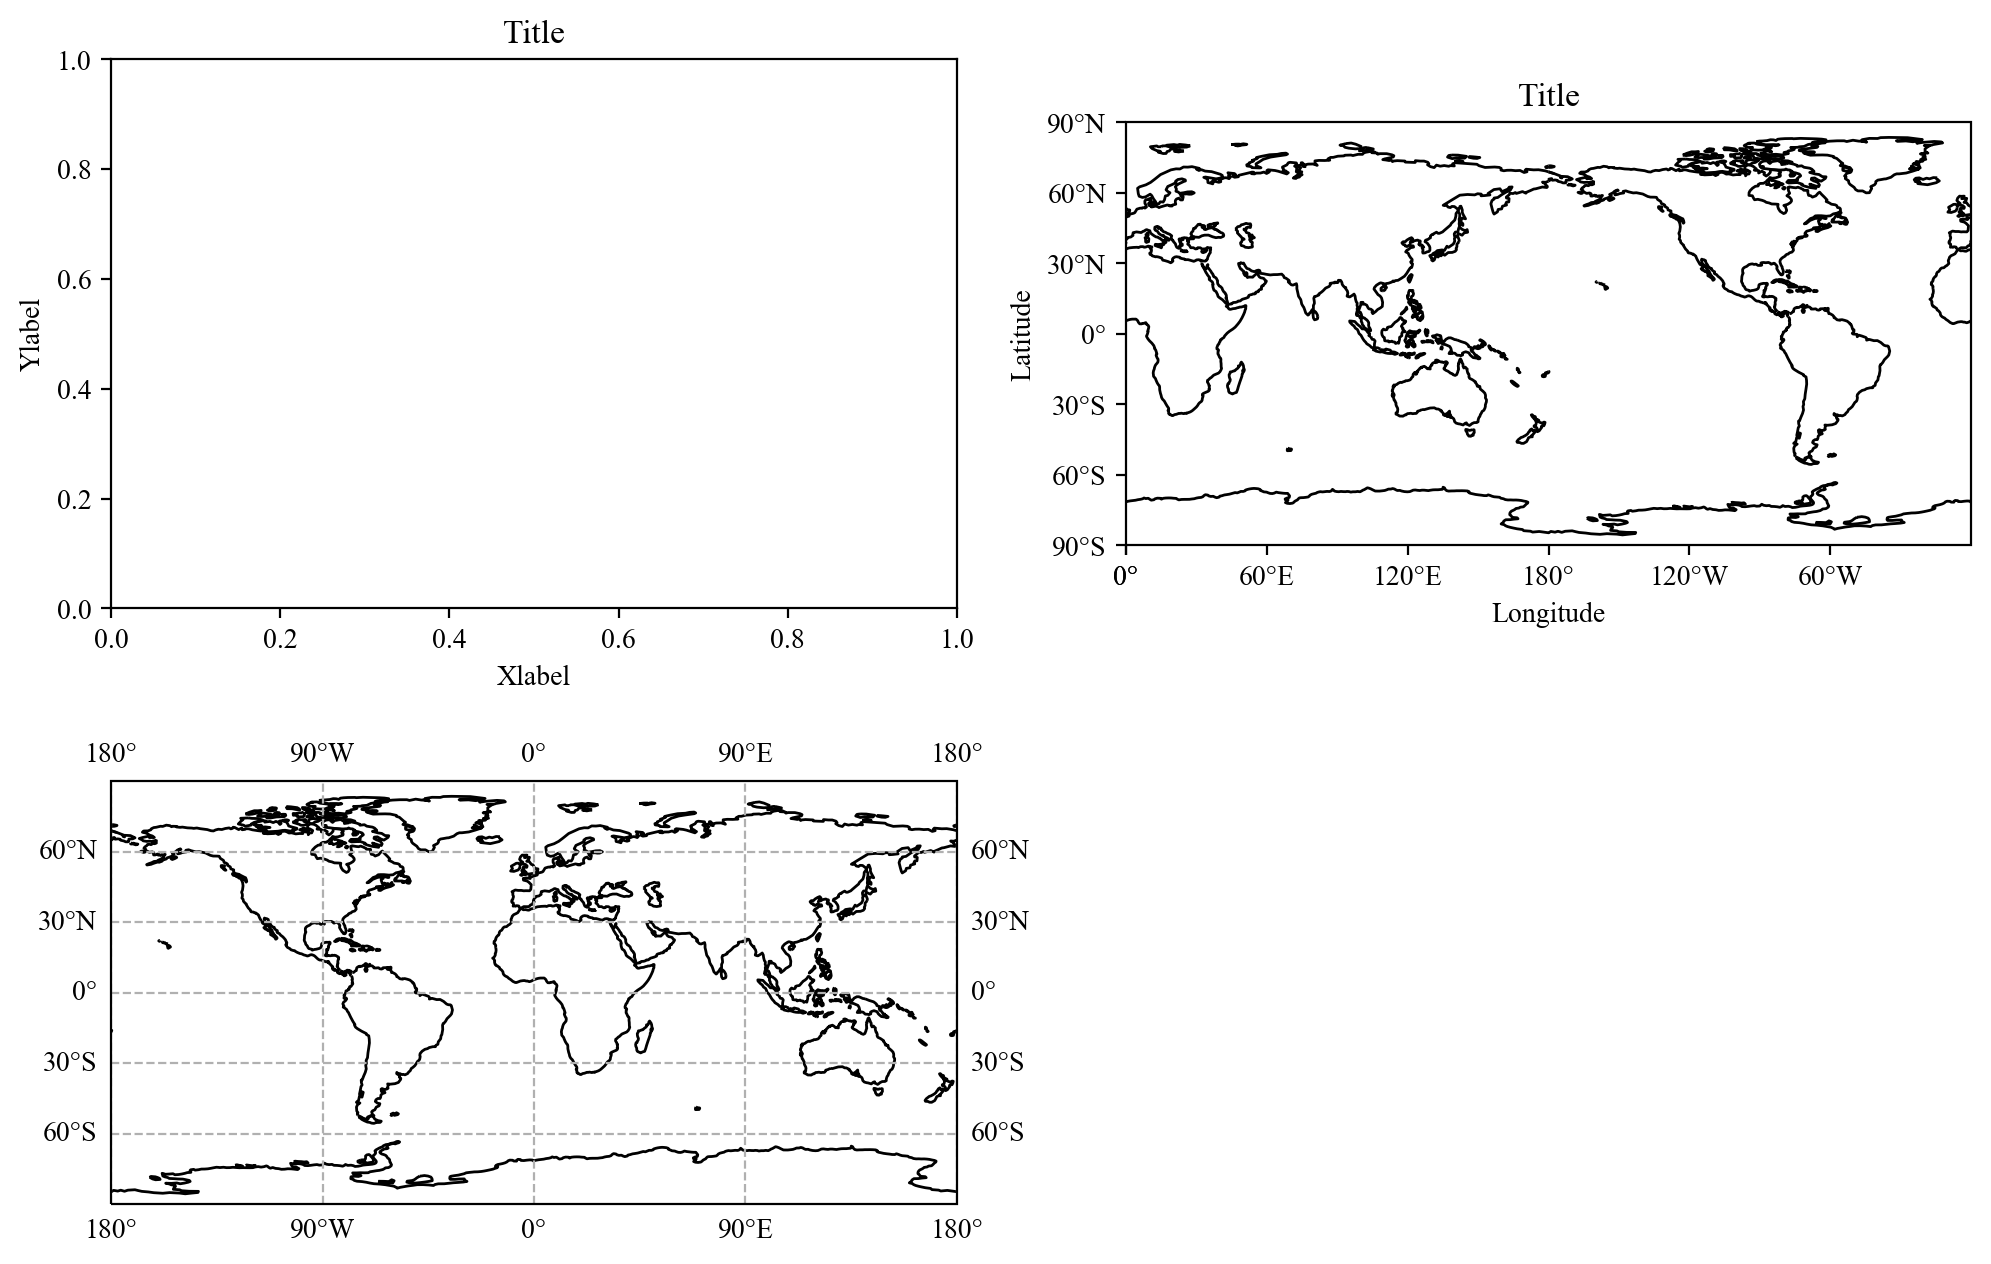
- 第一个子图是不带投影的,可以正常显示横纵轴标签和标题
- 第二个子图带有投影,横纵轴通过手动设置范围,可以正常显示横纵轴标签和标题
- 第三个子图带有投影,横纵轴的tick label通过gridlines设置,但是添加label之后却无法正常显示
不知道具体是什么原因很奇怪,代码如下:
# -*- coding: utf-8 -*-
"""
Created on Sun Jan 14 21:44:50 2024

@author: Jianpu

@blog:  https://blog.csdn.net/weixin_44237337?spm=1000.2115.3001.5343

@email: Xpji@hhu.edu.cn

@introduction: keep learning although slowly
"""


import matplotlib.pyplot as plt
import numpy as np
import cartopy.crs as crs
from cartopy.mpl.ticker import LongitudeFormatter, LatitudeFormatter

plt.rcParams['font.family'] = 'Times New Roman'

fig = plt.figure(dpi=200, figsize=(12,8))

ax1 = fig.add_subplot(2, 2, 1,)
ax1.set_xlabel('Xlabel')
ax1.set_ylabel('Ylabel')
ax1.set_title('Title')

# Add the second subplot with PlateCarree projection
ax2 = fig.add_subplot(2, 2, 2, projection=crs.PlateCarree(central_longitude=180))

ax2.set_xticks(np.arange(0, 361, 60), crs=crs.PlateCarree())
ax2.set_yticks(np.arange(-90, 91, 30), crs=crs.PlateCarree())
ax2.xaxis.set_major_formatter(LongitudeFormatter(zero_direction_label=False))
ax2.yaxis.set_major_formatter(LatitudeFormatter())
ax2.set_xlabel('Longitude')
ax2.set_ylabel('Latitude')
ax2.coastlines()
ax2.set_title('Title')


ax3 = fig.add_subplot(2, 2, 3, projection=crs.PlateCarree(central_longitude=0))
ax2.set_xlabel('Longitude')
ax3.set_ylabel('Latitude')
ax3.coastlines()
ax3.gridlines(draw_labels=True, xlocs=[-180, -90, 0, 90,180],linestyle='--')

plt.show()


 492
492


 被折叠的 条评论
为什么被折叠?
被折叠的 条评论
为什么被折叠?
 到【灌水乐园】发言


