


大家好,这里是玖叁叁,目前从事全栈工程师工作,刚刚接触 NebulaGraph 不久,还在努力学习当中。图数据库可以高效地表达、存储和分析复杂关系和网络,在特定场景下有着不错的性能。希望通过这篇 nebula-stats-exporter 的实践文章可以给各位读者朋友们一点启发。
一、介绍
nebula-stats-exporter是一个stats接口转换工具,可以将stats接口返回的数据转换为Prometheus可接受的数据格式,实现对NebulaGraph数据采集以及监控
二、环境
本篇文章将会对二进制部署以及docker-compose部署两种部署方式使用nebula-stats-exporter进行说明,均使用目前最新版本3.8.0
2.1、二进制部署
环境部署参考官方文档,使用RPM/DEB的方式部署。
# 下载安装包,我本地使用ubuntu 1804,下载对应安装包
https://oss-cdn.nebula-graph.com.cn/package/3.8.0/nebula-graph-3.8.0.ubuntu1804.amd64.deb
# 安装
sudo dpkg -i nebula-graph-3.8.0.ubuntu1804.amd64.deb
# 启动
sudo /usr/local/nebula/scripts/nebula.service start all
# 确认服务状态
$ sudo /usr/local/nebula/scripts/nebula.service status all
# 下载console工具,从下面的页面找对对应的版本下载
https://github.com/vesoft-inc/nebula-console/releases
# 重命名,并修改权限
mv nebula-console-linux-amd64-v3.8.0 nebula-console
chmod 755 nebula-console
# 使用console连接,注意实际上都是默认参数,直接使用./nebula-console就可以连接本地,不需要任何参数,密码默认为空
./nebula-console -addr <ip> -port <port> -u <username> -p <password>
# 注册 Storage 服务
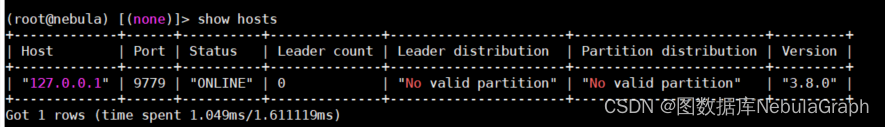
ADD HOSTS 127.0.0.1:9779
# 安装完成,截图留念
# 测试三个服务的stats接口,
Meta:curl 127.0.0.1:19559/stats
Graph:curl 127.0.0.1:19669/stats
Storage:curl 127.0.0.1:19779/stats
2.2、docker-compose部署
环境部署参考官方文档,使用docker-compose部署
# 下载
git clone -b release-3.8 https://github.com/vesoft-inc/nebula-docker-compose.git
# 切换路径
cd nebula-docker-compose/
# 修改docker-compose.yaml,为了开启stats接口访问
修改内容如下
Meta服务三处
- 29559:19559
- 39559:19559
- 49559:19559
Graph服务三处
- 29669:19669
- 39669:19669
- 49669:19669
Storage服务三处
- 29779:19779
- 39779:19779
- 49779:19779
# 启动服务
docker-compose up -d
# docker部署无需手动添加Storage,使用console连接查看,服务正常

# 测试服务的stats接口,
Meta
curl 127.0.0.1:29559/stats
curl 127.0.0.1:39559/stats
curl 127.0.0.1:49559/stats
Graph:
curl 127.0.0.1:29669/stats
curl 127.0.0.1:39669/stats
curl 127.0.0.1:49669/stats
Storage
curl 127.0.0.1:29779/stats
curl 127.0.0.1:39779/stats
curl 127.0.0.1:49779/stats
三、nebula-stats-exporte安装配置
3.1、RPM/DEB方式部署的nebula,对应使用二进制方式部署nebula-stats-exporte
# 下载
git clone https://github.com/vesoft-inc/nebula-stats-exporter.git

# 编译
cd nebula-stats-exporter
make build

# 创建config.yaml
vim config.yaml

# 内容
clusters:
  - name: nebula
    instances:
      - name: metad
        endpointIP: 127.0.0.1
        endpointPort: 19559
        componentType: metad
      - name: graphd
        endpointIP: 127.0.0.1
        endpointPort: 19669
        componentType: graphd
      - name: storaged0
        endpointIP: 127.0.0.1
        endpointPort: 19779
        componentType: storaged

# 启动服务
./nebula-stats-exporter --bare-metal --bare-metal-config=./config.yaml

# 服务正常启动,改为后台运行模式,截图留念
nohup ./nebula-stats-exporter --bare-metal --bare-metal-config=./config.yaml > nebula-stats-exporter.log  2>&1 &

# 测试接口
curl 127.0.0.1:9100/metrics
3.2、docker-compose部署nebula,对应使用docker方式nebula-stats-exporte
# # 创建config.yaml
vim config.yaml

# 内容
clusters:
  - name: nebula
    instances:
      - name: metad0
        endpointIP: 127.0.0.1
        endpointPort: 29559
        componentType: metad
      - name: metad1
        endpointIP: 127.0.0.1
        endpointPort: 39559
        componentType: metad
      - name: metad2
        endpointIP: 127.0.0.1
        endpointPort: 49559
        componentType: metad
      - name: graphd0
        endpointIP: 127.0.0.1
        endpointPort: 29669
        componentType: graphd
      - name: graphd1
        endpointIP: 127.0.0.1
        endpointPort: 39669
        componentType: graphd
      - name: graphd2
        endpointIP: 127.0.0.1
        endpointPort: 49669
        componentType: graphd
      - name: storaged0
        endpointIP: 127.0.0.1
        endpointPort: 29779
        componentType: storaged
      - name: storaged1
        endpointIP: 127.0.0.1
        endpointPort: 39779
        componentType: storaged
      - name: storaged2
        endpointIP: 127.0.0.1
        endpointPort: 49779
        componentType: storaged


# 启动,需要注意config.yaml路径按实际修改,我为了方便使用127.0.0.1 将-p 9100:9100 换成了--network=host,直接使用主机网络(因为容器部署使用bridge网络,127.0.0.1只能连接容器内)
docker run -d --restart=always --name nebula-stats-exporter -p 9100:9100 \
    -v "$(pwd)/deploy/bare-metal/config.yaml:/config.yaml" \
    vesoft/nebula-stats-exporter:v3.3.0 --bare-metal --bare-metal-config=/config.yaml

# 查看日志
docker logs -f nebula-stats-exporter

# 截图留念

四、整合Prometheus和grafana
无论使用那种方式部署nebula和nebula-stats-exporter,这部分内容是一样的
4.1、安装Prometheus和grafana,请参考官方文档,此处不是文章主要内容
4.2、Prometheus配置文件
# 编辑prometheus.yml
vim prometheus.yml

# 内容,根据实际IP填写
scrape_configs:
  - job_name: 'nebula-stats-exporter'
    static_configs:
      - targets: ['127.0.0.1:9100']

# 访问9090端口,查看是否正常
# 截图留念

4.3、grafana配置
4.3.1、添加Prometheus数据源


4.3.2、导入dashboard样式,
# 下载地址
https://github.com/vesoft-inc/nebula-stats-exporter/blob/master/deploy/grafana/nebula-grafana.json


五、总结
本文阐述了使用nebula-stats-exporter对nebula各个服务进行监控的方式,希望能对大家有所帮


 177
177


 被折叠的 条评论
为什么被折叠?
被折叠的 条评论
为什么被折叠?
 到【灌水乐园】发言


