前言
应项目需要实现自定义的label、popup到地图上并跟随地图移动,官网提供方式为使用labelinginfo实现,但由于本项目前期存在的一些遗留问题导致使用labelinginfo实现存在一些问题,所以只能自定义实现。
效果
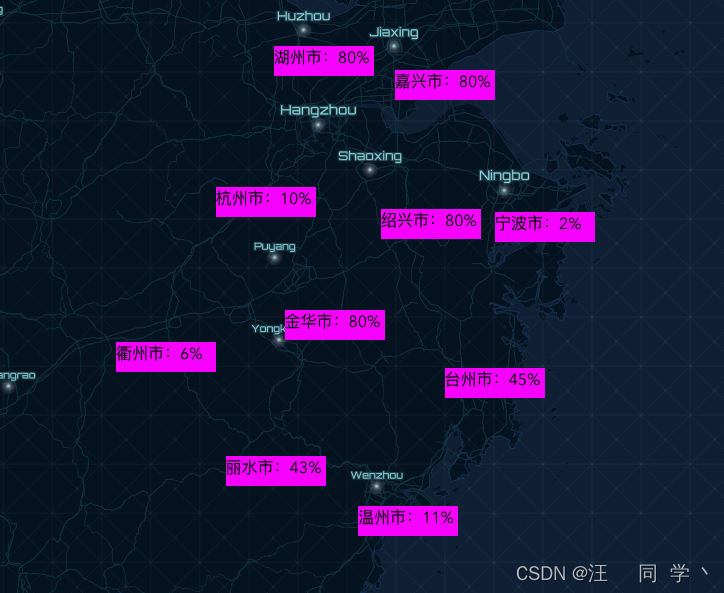
实现方案
<html>
<head>
<meta charset="utf-8" />
<meta
name="viewport"
content="initial-scale=1,maximum-scale=1,user-scalable=no"
/>
<title></title>
<link
rel="stylesheet"
href="https://js.arcgis.com/4.23/esri/themes/light/main.css"
/>
<script src="https://js.arcgis.com/4.23/"></script>
<style>
html,
body,
#viewDiv {
padding: 0;
margin: 0;
height: 100%;
width: 100%;
}
.popup-label {
width: 100px;
height: 30px;
background-color: #f0f;
position: absolute;
}
</style>
<script>
require([
"esri/Map",
"esri/views/MapView",
"esri/portal/Portal",
"esri/widgets/BasemapGallery",
"esri/widgets/BasemapGallery/support/PortalBasemapsSource",
"esri/widgets/Expand"
], function (
Map,
MapView,
Portal,
BasemapGallery,
PortalBasemapsSource,
Expand
) {
const portal = new Portal();
const source = new PortalBasemapsSource({
portal,
query: {
id: "bdb9d65e0b5c480c8dcc6916e7f4e099"
}
});
const map = new Map({
basemap: {
portalItem: {
id: "8d91bd39e873417ea21673e0fee87604"
}
}
});
const view = new MapView({
container: "viewDiv",
map: map,
center: [121, 30],
zoom: 4,
constraints: {
snapToZoom: false
}
});
const list = [
{
name: '湖州市',
latlng: [119.8869788092502, 30.757413211115384],
rate: '80%'
},
{
name: '嘉兴市',
latlng: [120.75392713900366, 30.609263812992957],
rate: '80%'
},
{
name: '杭州市',
latlng: [119.46996568860929, 29.884977866616644],
rate: '10%'
},
{
name: '绍兴市',
latlng: [120.65516087358871, 29.747802497984765],
rate: '80%'
},
{
name: '宁波市',
latlng: [121.47272607063469, 29.73134145374894],
rate: '2%'
},
{
name: '金华市',
latlng: [119.96379701568405, 29.11679580227813],
rate: '80%'
},
{
name: '衢州市',
latlng: [118.75665377172352, 28.919263271448227],
rate: '6%'
},
{
name: '台州市',
latlng: [121.11058309744654, 28.754652829089974],
rate: '45%'
},
{
name: '丽水市',
latlng: [119.54129688029786, 28.200464339817188],
rate: '43%'
},
{
name: '温州市',
latlng: [120.49055043123046, 27.882217484591234],
rate: '11%'
}
]
setTimeout(() => {
for (let i = 0; i < list.length; i++) {
const current = list[i]
const xy = view.toScreen({
x: current.latlng[0],
y: current.latlng[1],
spatialReference: {
wkid: 4326
}
})
const div = document.createElement('div')
div.classList.add('popup-label')
div.style.left = xy.x + 'px'
div.style.top = xy.y + 'px'
div.innerHTML = current.name + ':' + current.rate
div.setAttribute('lx', current.latlng[0])
div.setAttribute('ly', current.latlng[1])
document.querySelector('.esri-view-surface').appendChild(div)
}
}, 6000)
document.addEventListener('mousewheel', setPopupLabelPosition)
view.on('drag', setPopupLabelPosition)
function setPopupLabelPosition(e) {
const popupLabels = document.querySelectorAll('.popup-label')
if (!popupLabels || popupLabels.length === 0) return
Array.from(popupLabels).forEach((pl) => {
const lx = pl.getAttribute('lx')
const ly = pl.getAttribute('ly')
const xy = view.toScreen({
x: lx,
y: ly,
spatialReference: {
wkid: 4326
}
})
pl.style.left = xy.x + 'px'
pl.style.top = xy.y + 'px'
})
}
view.on('click', () => {
const popupLabels = document.querySelectorAll('.popup-label')
Array.from(popupLabels).forEach((pl) => {
pl.remove()
})
})
});
</script>
</head>
<body>
<div id="viewDiv"></div>
<div id="srDiv" class="esri-widget"></div>
</body>
</html>


 2692
2692


 被折叠的 条评论
为什么被折叠?
被折叠的 条评论
为什么被折叠?
 到【灌水乐园】发言


