前言
基于echarts5.x和vue2实现
记录以便日后查阅
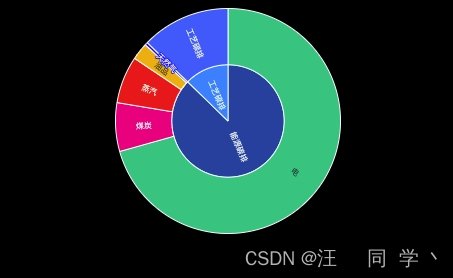
实现效果
代码实现
<template>
<div class="chart-wrap">
<div id="chart14" class="chart" />
</div>
</template>
<script>
export default {
name: 'Index',
data () {
return {
chart: null,
data: [
{
name: '工艺碳排',
value: 12.73,
itemStyle: {
color: '#0091FF'
},
children: [
{
name: '工艺碳排',
value: 12.73,
itemStyle: {
color: '#2A6DFB'
}
}]
},
{
name: '能源碳排',
itemStyle: {
color: '#124EA7'
},
children: [
{
name: '电',
value: 70.64,
itemStyle: {
color: '#06C88C'
}
},
{
name: '天然气',
value: 0.41,
itemStyle: {
color: '#0028F7'
}
},
{
name: '蒸汽',
value: 6.78,
itemStyle: {
color: '#F72000'
}
},
{
name: '煤炭',
value: 6.98,
itemStyle: {
color: '#F70084'
}
},
{
name: '油品',
value: 2.46,
itemStyle: {
color: '#F7B500'
}
}
]
}
]
}
},
mounted() {
this.createChartHandler()
},
methods: {
createChartHandler () {
this.chart = this.$echarts.init(document.getElementById('chart14'))
this.chart.setOption(this.getChartOption(this.data))
window.addEventListener('resize', () => {
setTimeout(() => {
this.chart.resize()
})
})
},
getChartOption (data) {
return {
tooltip: {
trigger: 'axis',
extraCssText: 'color:#fff;background: rgba(0, 38, 118, 0.5);border:none; box-shadow: 0px 0px 8px 1px rgba(0, 145, 255, 0.5);border-radius: 2px;',
axisPointer: {
type: 'none'
}
},
series: {
type: 'sunburst',
emphasis: {
focus: 'ancestor'
},
data: data,
radius: [0, '90%'],
label: {
rotate: 'radial',
fontSize: 8
}
}
}
}
}
}
</script>


 8313
8313


 被折叠的 条评论
为什么被折叠?
被折叠的 条评论
为什么被折叠?
 到【灌水乐园】发言


