


B站账号@狼群里的小杨,记得点赞收藏加关注,一键三连哦!
mplot3d
绘制三维图像
内置于matplotlib
Figure对象、Axes3d对象
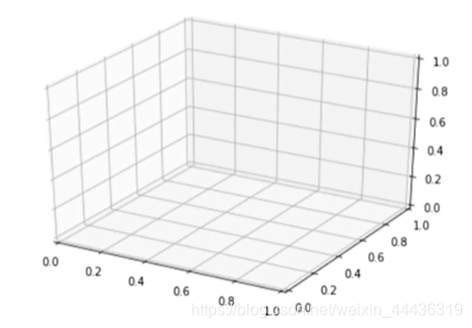
显示三维坐标空间
import matplotlib.pyplot as plt
from mpl_toolkits.mplot3d import Axes3D

fig = plt.figure()
ax3d = Axes3d(fig)
plt.show()
- 绘制散点图——scatter(x,y,z)
import numpy as np
import matplotlib.pyplot as plt
from mpl_toolkits.mplot3d import Axes3D


x = np.random.uniform(10,40,30)
y = np.random
最低0.47元/天 解锁文章


 被折叠的 条评论
为什么被折叠?
被折叠的 条评论
为什么被折叠?
 到【灌水乐园】发言


