


matplotlib直方图
直方图注意事项:
- 组数:将数据分组,当数据在100以内,按数据多少常分5-12组
组数=极差/组距=(max(a)-min(a))/组距 - 组距:每个小组两个端点之间的距离
- 只有未经统计的原始数据才能绘制直方图(使用hist方法)
'''
已有250部电影的时长,希望统计出这些电影时长的分布状态(比如时长为100分钟到120分钟电影的数量,出现的频率)等信息
a=[131,  98, 125, 131, 124, 139, 131, 117, 128, 108, 135, 138, 131, 102, 107, 114, 119, 128, 121, 142, 127, 130, 124, 101, 110, 116, 117, 110, 128, 128, 115,  99, 136, 126, 134,  95, 138, 117, 111,78, 132, 124, 113, 150, 110, 117,  86,  95, 144, 105, 126, 130,126, 130, 126, 116, 123, 106, 112, 138, 123,  86, 101,  99, 136,123, 117, 119, 105, 137, 123, 128, 125, 104, 109, 134, 125, 127,105, 120, 107, 129, 116, 108, 132, 103, 136, 118, 102, 120, 114,105, 115, 132, 145, 119, 121, 112, 139, 125, 138, 109, 132, 134,156, 106, 117, 127, 144, 139, 139, 119, 140,  83, 110, 102,123,107, 143, 115, 136, 118, 139, 123, 112, 118, 125, 109, 119, 133,112, 114, 122, 109, 106, 123, 116, 131, 127, 115, 118, 112, 135,115, 146, 137, 116, 103, 144,  83, 123, 111, 110, 111, 100, 154,136, 100, 118, 119, 133, 134, 106, 129, 126, 110, 111, 109, 141,120, 117, 106, 149, 122, 122, 110, 118, 127, 121, 114, 125, 126,114, 140, 103, 130, 141, 117, 106, 114, 121, 114, 133, 137,  92,121, 112, 146,  97, 137, 105,  98, 117, 112,  81,  97, 139, 113,134, 106, 144, 110, 137, 137, 111, 104, 117, 100, 111, 101, 110,105, 129, 137, 112, 120, 113, 133, 112,  83,  94, 146, 133, 101,131, 116, 111,  84, 137, 115, 122, 106, 144, 109, 123, 116, 111,111, 133, 150]
'''

from matplotlib import pyplot as plt

# 设计图形大小
plt.figure(figsize=(15, 5), dpi=80)

# 数据准备
x = [131, 98, 125, 131, 124, 139, 131, 117, 128, 108, 135, 138, 131, 102, 107, 114, 119, 128, 121, 142, 127, 130, 124,
     101, 110, 116, 117, 110, 128, 128, 115, 99, 136, 126, 134, 95, 138, 117, 111, 78, 132, 124, 113, 150, 110, 117, 86,
     95, 144, 105, 126, 130, 126, 130, 126, 116, 123, 106, 112, 138, 123, 86, 101, 99, 136, 123, 117, 119, 105, 137,
     123, 128, 125, 104, 109, 134, 125, 127, 105, 120, 107, 129, 116, 108, 132, 103, 136, 118, 102, 120, 114, 105, 115,
     132, 145, 119, 121, 112, 139, 125, 138, 109, 132, 134, 156, 106, 117, 127, 144, 139, 139, 119, 140, 83, 110, 102,
     123, 107, 143, 115, 136, 118, 139, 123, 112, 118, 125, 109, 119, 133, 112, 114, 122, 109, 106, 123, 116, 131, 127,
     115, 118, 112, 135, 115, 146, 137, 116, 103, 144, 83, 123, 111, 110, 111, 100, 154, 136, 100, 118, 119, 133, 134,
     106, 129, 126, 110, 111, 109, 141, 120, 117, 106, 149, 122, 122, 110, 118, 127, 121, 114, 125, 126, 114, 140, 103,
     130, 141, 117, 106, 114, 121, 114, 133, 137, 92, 121, 112, 146, 97, 137, 105, 98, 117, 112, 81, 97, 139, 113, 134,
     106, 144, 110, 137, 137, 111, 104, 117, 100, 111, 101, 110, 105, 129, 137, 112, 120, 113, 133, 112, 83, 94, 146,
     133, 101, 131, 116, 111, 84, 137, 115, 122, 106, 144, 109, 123, 116, 111, 111, 133, 150]

# 计算组数
d = 3  # 组距
num = (max(x) - min(x)) // d  # 组数计算公式,组数=极差/组距=(max(a)-min(a))/组距

# 设置坐标轴显示
plt.xticks(range(min(x), max(x) + d, d))

plt.hist(x, num, rwidth=d)  # 当组数计算公式存在小数时会导致图形的移位
plt.grid(alpha=0.3, linestyle='--')
plt.show()
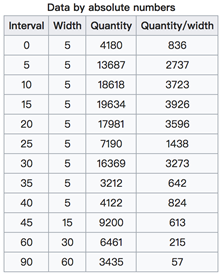
在美国2004年人口普查发现有124 million的人在离家相对较远的地方工作。根据他们从家到上班地点所需要的时间,通过抽样统计得出了下表的数据
interval = [0,5,10,15,20,25,30,35,40,45,60,90]
width = [5,5,5,5,5,5,5,5,5,15,30,60]
quantity = [836,2737,3723,3926,3596,1438,3273,642,824,613,215,47]
'''
非原始数据,无法用hist绘制直方图,可以通过条形图模拟直方图
'''
from matplotlib import pyplot as plt

# 设置大小
plt.figure(figsize=(15, 5), dpi=80)

# 数据准备
x = [0, 5, 10, 15, 20, 25, 30, 35, 40, 45, 60, 90]  # 坐标轴缺少90+60=150的刻度,对x轴显示刻度手动调整
# width = [5,5,5,5,5,5,5,5,5,15,30,60]  # 直方图中的组距,用来对应x轴的刻度展示
y = [836, 2737, 3723, 3926, 3596, 1438, 3273, 642, 824, 613, 215, 47]

# 设置数据轴刻度
_x = [i - 0.5 for i in range(len(x) + 1)]
x_lable = [0, 5, 10, 15, 20, 25, 30, 35, 40, 45, 60, 90] + [150]
plt.xticks(_x, x_lable)

# 作图
plt.bar(range(len(x)), y, width=1)  # 用等间距数字在x轴上占位,宽度设置成1使得柱子相邻模拟直方图
plt.grid(alpha=0.3, linestyle='--')
plt.show()
matplotlib总结

ps:更多酷炫可交互图表可查询JS框架【echarts】https://echarts.apache.org/examples/zh/index.html


 250
250


 被折叠的 条评论
为什么被折叠?
被折叠的 条评论
为什么被折叠?
 到【灌水乐园】发言


