


1.前言
这个功能查资料+写代码调试研究了三天,记录一下。大学学了这个正态分布的,全部忘完了,而且根本不知道啥意思,一开始很蒙蔽。第一次写csdn文章,不好的地方望大家理解。用得是WPF,但是由于demo简单,我就没前后端分离了。所以winform也是一样看。
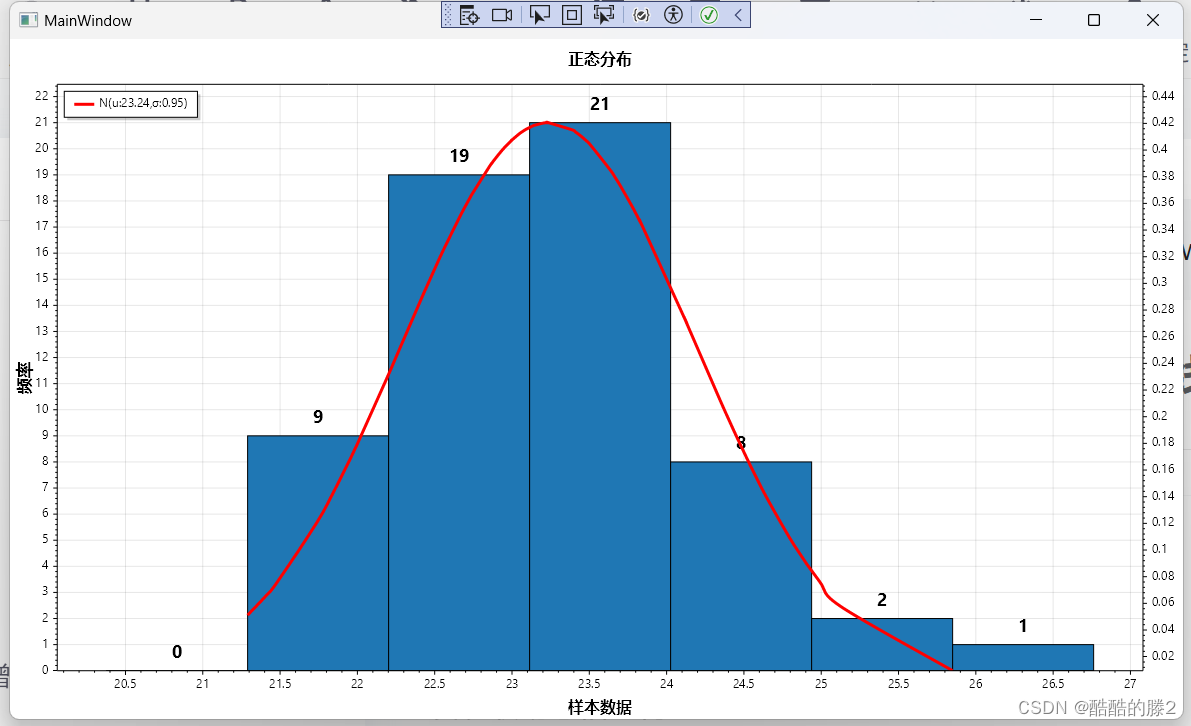
我这边遇到的主要难题,也是需要注意的地方:1.正态曲线怎么画。后面明白了就是要根据样本数据算出对应的正态值。然后画出折线图,最后平滑折线图。
2.直方图和正态分布怎么结合的问题。其实单独话直方图简单,但是要两个一起画,还能直方图数据对应上当时把我难住了。有时候我直方图会左偏一点,原因就是因为我没有设置直方图的宽度,之前没找到。还有就是要用双坐标系。两个纵坐标,因为正态值很小,两个图放在一起会导致正态曲线显示不出来。
2.效果图

3.代码展示
1.主界面代码
<Window
    x:Class="ND.MainWindow"
    xmlns="http://schemas.microsoft.com/winfx/2006/xaml/presentation"
    xmlns:x="http://schemas.microsoft.com/winfx/2006/xaml"
    xmlns:ScottPlot="clr-namespace:ScottPlot.WPF;assembly=ScottPlot.WPF"
    xmlns:d="http://schemas.microsoft.com/expression/blend/2008"
    xmlns:local="clr-namespace:ND"
    xmlns:mc="http://schemas.openxmlformats.org/markup-compatibility/2006"
    Title="MainWindow"
    Width="1200"
    Height="800"
    mc:Ignorable="d">
    <Grid>
        <Grid.RowDefinitions>
            <RowDefinition />
            <RowDefinition Height="auto" />
        </Grid.RowDefinitions>
        <UniformGrid Rows="1">
            <ScottPlot:WpfPlot x:Name="WpfPlot1" />
        </UniformGrid>
    </Grid>
</Window>
2.后端代码
using ScottPlot;
using ScottPlot.WPF;
using System.Collections.Generic;
using System.Linq;
using System.Windows;
using Color = ScottPlot.Color;
using Colors = ScottPlot.Colors;

namespace ND
{
    /// <summary>
    /// MainWindow.xaml 的交互逻辑
    /// </summary>
    public partial class MainWindow : Window
    {
        /// <summary>
        /// 正态分布类
        /// </summary>
        StandardDistribution standardDistribution1 = null;
        public MainWindow()
        {
            InitializeComponent();
            //从Excel读取某列的数据
            List<string> result = ExcelHelper.ReadLIne(@"数据样本1.xlsx", 0, 6);
            //把读出的数据转为double类型
            List<double> doubles = result.Select(i => double.Parse(i)).ToList();
            //正泰分布类,传入样本数据和要分组的个数
            standardDistribution1 = new StandardDistribution(doubles, 6);
            //显示曲线方法
            PlotData(standardDistribution1, WpfPlot1);
        }
        /// <summary>
        /// 显示曲线
        /// </summary>
        /// <param name="standardDistribution">正泰分布对象</param>
        /// <param name="WpfPlot">曲线名字</param>
        private void PlotData(StandardDistribution standardDistribution, WpfPlot WpfPlot)
        {
            //分组, 定出5个值,最大值、最小值、极差、分组数、组距。
            //上面传参分了6组,我们实际可以比最小值小一个,比最大值大一个,所以共了用8组
            List<double> xList = new List<double>();
            double XBarValue = standardDistribution.XsMin;
            xList.Add(XBarValue - standardDistribution.GroupLenth);
            for (int i = 0; i < standardDistribution.GroupCount; i++)
            {
                xList.Add(XBarValue);
                XBarValue = XBarValue + standardDistribution.GroupLenth;

            }
            xList.Add(standardDistribution.XsMax + standardDistribution.GroupLenth);

            //分组后用Linq算出每个分组的频率(就是数据在某个范围出现的个数)
            List<double> YList = new List<double>();
            for (int i = 0; i < xList.Count; i++)
            {
                if (i + 1 < xList.Count)
                {
                    var Count = standardDistribution.XDatas.Count(n => n >= xList[i] && n < xList[i + 1]);
                    YList.Add(Count);
                }
            }

            //添加直方图,
            //1.直方图的宽度要设置为StandardDistribution类中的组距。
            //2.直方图的X坐标也要和下一个数据除以2.
            //执行第一步和第二部,直方图和正态分布图才能完美匹配。
            //这点有点坑,一直分布图和直方图匹配不上,我之前研究了一段时间。应该还有其他办法。
            List<Bar> barList = new List<Bar>();

            for (int i = 0; i < xList.Count; i++)
            {
                if (i + 1 < xList.Count)
                {
                    var Count = (xList[i] + xList[i + 1]) / 2;
                    Bar bar = new Bar();
                    bar.Position = Count;
                    bar.Value = YList[i];
                    bar.Size = standardDistribution.GroupLenth;
                    bar.FillColor = Color.FromHex("#1F77B4");
                    barList.Add(bar);
                }

            }

            var barPlot = WpfPlot.Plot.Add.Bars(barList.ToArray());
            // define the content of labels
            foreach (var bar in barPlot.Bars)
            {
                bar.Label = bar.Value.ToString();
            }

            // customize label style
            barPlot.ValueLabelStyle.Bold = true;
            barPlot.ValueLabelStyle.FontSize = 18;
            //纵坐标系_给频率用
            barPlot.Axes.YAxis = WpfPlot.Plot.Axes.Left;

            //正态分布显示,主要就是那个公式研究明白。fx=1/√2πσ ***。公式不好打出来,可以百度一下这个公式。
            //根据公式舅娘明白StandardDistribution这个类怎么写了。正态分布图显示的原理 就是根据x点算出对应的正态值。多算几组然后用折线图画出来,最后把折线图平滑,就有正态分布图曲线了。
            //**注意观察图片,有两个纵坐标系。如果只有一个,因为正态分布的值算出来很小,会导致显示不出来曲线(最开始我是把正态分布值*500来放大,这种方法不太好)。这个问题当时也研究了一段时间。
            var result222 = standardDistribution.GetGaussianDistributionYs().OrderBy(x => x.Item1).ToList(); ;
            double[] doublesx = result222.Select(x => x.Item1).ToArray();
            double[] doublesY = result222.Select(x => x.Item2).ToArray();
            var sp = WpfPlot.Plot.Add.Scatter(doublesx, doublesY);
            sp.LineColor = Colors.Red;
            //把折线平滑
            sp.Smooth = true;
            sp.LegendText = $"N(u:{standardDistribution.Average.ToString("0.00")},σ:{standardDistribution.StandardVariance.ToString("0.00")})";
            sp.LineWidth = 3;
            sp.MarkerSize = 0;
            //纵坐标系_给正态分布值用
            sp.Axes.YAxis = WpfPlot.Plot.Axes.Right;
            WpfPlot.Plot.Axes.Margins(bottom: 0);
            WpfPlot.Plot.ShowLegend(Alignment.UpperLeft);
            WpfPlot.Plot.XLabel("样本数据");
            WpfPlot.Plot.YLabel("频率");
            WpfPlot.Plot.Title("正态分布");
            WpfPlot.Plot.Font.Automatic();
            WpfPlot.Refresh();
        }

    }
}
3.正态分布类
using System;
using System.Collections.Generic;
using System.Linq;

namespace ND
{
    /// <summary>
    /// 提供正态分布,以及直方图
    /// </summary>
    public class StandardDistribution
    {
        #region 属性
        /// <summary>
        /// 最大值
        /// </summary>
        public double XsMax { get; set; }
        /// <summary>
        /// 最小值
        /// </summary>
        public double XsMin { get; set; }

        /// <summary>
        /// 组数量
        /// </summary>
        public int GroupCount { get; set; }

        /// <summary>
        /// 组距
        /// </summary>
        public double GroupLenth { get; set; }

        /// <summary>
        /// 样本数据
        /// </summary>
        public List<double> XDatas{ get; set; }

        /// <summary>
        /// 方差
        /// </summary>
        public double Variance { get; private set; }

        /// <summary>
        /// 标准方差
        /// </summary>
        public double StandardVariance { get; private set; }

        /// <summary>
        /// 数学期望
        /// </summary>
        public double Average { get; private set; }

        /// <summary>
        ///  1/2π的平方根的值
        /// </summary>
        public static double InverseSqrt2PI = 1 / Math.Sqrt(2 * Math.PI);
        #endregion

        #region 构造方法
        public StandardDistribution(List<double> XDatas, int GroupCount)
        {
            this.XDatas = XDatas;
            XsMax = XDatas.Max();
            XsMin = XDatas.Min();
            this.GroupCount = GroupCount;
            GroupLenth = (XsMax - XsMin) / (GroupCount - 1);
            Average = XDatas.Average();
            Variance = GetVariance(XDatas);
            if (Variance == 0) throw new Exception("方差为0");//此时不需要统计 因为每个样本数据都相同,可以在界面做相应提示
            StandardVariance = Math.Sqrt(Variance);
        }
        #endregion

        /// <summary>
        /// 获取指定X值的Y值
        /// </summary>
        /// <param name="x"></param>
        /// <returns></returns>
        public double GetGaussianDistributionY(double x)
        {
            double Pow = -(Math.Pow(Math.Abs(x - Average), 2) / (2 * Variance));

            double result = (InverseSqrt2PI / StandardVariance) * Math.Pow(Math.E, Pow);

            return result;
        }

        /// <summary>
        /// 获取坐标
        /// </summary>
        /// <returns></returns>
        public List<Tuple<double, double>> GetGaussianDistributionYs()
        {
            List<Tuple<double, double>> XYs = new List<Tuple<double, double>>();

            Tuple<double, double> xy = null;

            foreach (double x in XDatas)
            {
                xy = new Tuple<double, double>(x, GetGaussianDistributionY(x));
                XYs.Add(xy);
            }
            return XYs;
        }
        /// <summary>
        /// 获取方差
        /// </summary>
        /// <param name="src"></param>
        /// <returns></returns>
        public static double GetVariance(List<double> src)
        {
            double average = src.Average();
            double SumOfSquares = 0;
            src.ForEach(x => { SumOfSquares += Math.Pow(x - average, 2); });
            return SumOfSquares / src.Count;//方差
        }

    }
}
4.Excel数据读取类
using NPOI.SS.UserModel;
using NPOI.XSSF.UserModel;
using System;
using System.Collections.Generic;
using System.IO;
using System.Text.RegularExpressions;

namespace ND
{
    public class ExcelHelper
    {
        #region 读取Excel某列数据

        /// <summary>
        /// 根据索引读取一列的数据并删除不需要的
        /// </summary>
        /// <param name="ExcelPath"></param>
        /// <param name="index"></param>
        /// <returns></returns>
        public static List<string> ReadLIne(string ExcelPath, int SheetIndex, int Lineindex)
        {
            List<string> stringList = new List<string>();
            XSSFWorkbook wk = null;
            using (FileStream fs = File.Open(ExcelPath, FileMode.Open, FileAccess.Read, FileShare.ReadWrite))
            {
                //把xls文件读入workbook变量里,之后就可以关闭了
                wk = new XSSFWorkbook(fs);
                fs.Close();
            }
            try
            {
                XSSFSheet sheet1 = (XSSFSheet)wk.GetSheetAt(SheetIndex);

                int a = sheet1.LastRowNum;

                for (int i = 0; i <= a; i++)
                {
                    var prop = string.Empty;
                    if (sheet1.GetRow(i).GetCell(Lineindex) != null)
                    {


                        sheet1.GetRow(i).GetCell(Lineindex).SetCellType(CellType.String);

                        prop = sheet1.GetRow(i).GetCell(Lineindex).StringCellValue;
                    }
                    if (IsNumber(prop))
                    {
                        stringList.Add(prop);
                    }
                }

                return stringList;
            }
            catch (Exception ex)
            {
                throw new Exception("错误代码E06,根据索引读取一列的数据并删除不需要的" + ex.Message);
            }
        }
        #endregion
        #region 判断是否为数字
        /// <summary>
        /// 判断字符串是否是数字
        /// </summary>
        public static bool IsNumber(string s)
        {
            if (string.IsNullOrWhiteSpace(s)) return false;
            const string pattern = "^[0-9]*$|^(-?\\d+)(\\.\\d+)?$";
            Regex rx = new Regex(pattern);
            return rx.IsMatch(s);
        }

        #endregion 判断是否为数字
    }


}
4.参考资料
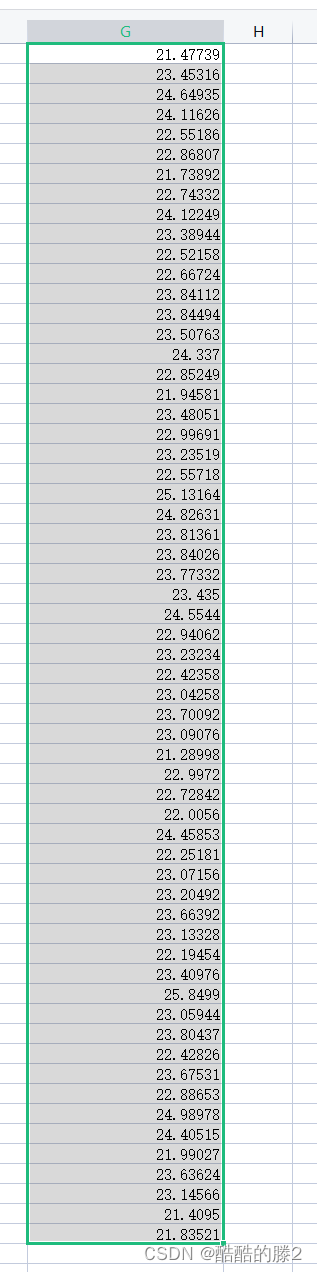
1.样本数据
因为我是读的Excel表格数据,读得仪器的数据,之前我是手敲数据,手敲太麻烦了,所以就读Excel了这是数据展示。
2.ScottPlot控件库
需要在nuget去安装。这个百度一下就好了。


 1081
1081


 被折叠的 条评论
为什么被折叠?
被折叠的 条评论
为什么被折叠?
 到【灌水乐园】发言


