


import numpy as np
import matplotlib.pyplot as plt


def step_function(x):
    return np.array(x > 0, dtype=np.int)


x = np.arange(-0.5, 0.5, 0.01)
y = step_function(x)

plt.plot(x, y)
plt.ylim(-0.1, 1.1) # 指定y轴的范围
plt.ylabel('y')
plt.xlabel('x')
plt.title('step function')
plt.show()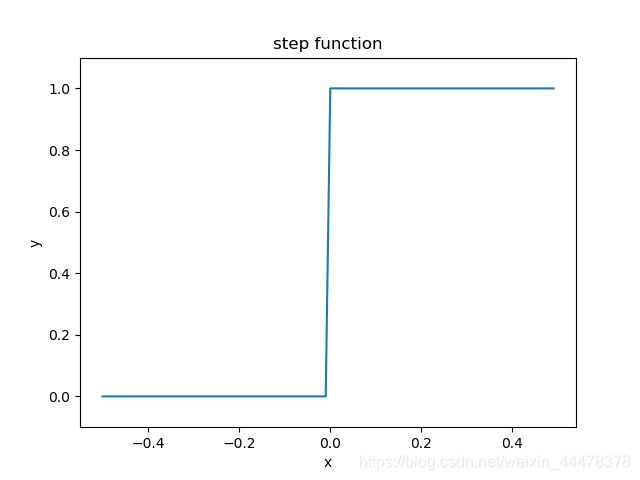


 被折叠的 条评论
为什么被折叠?
被折叠的 条评论
为什么被折叠?
 到【灌水乐园】发言


