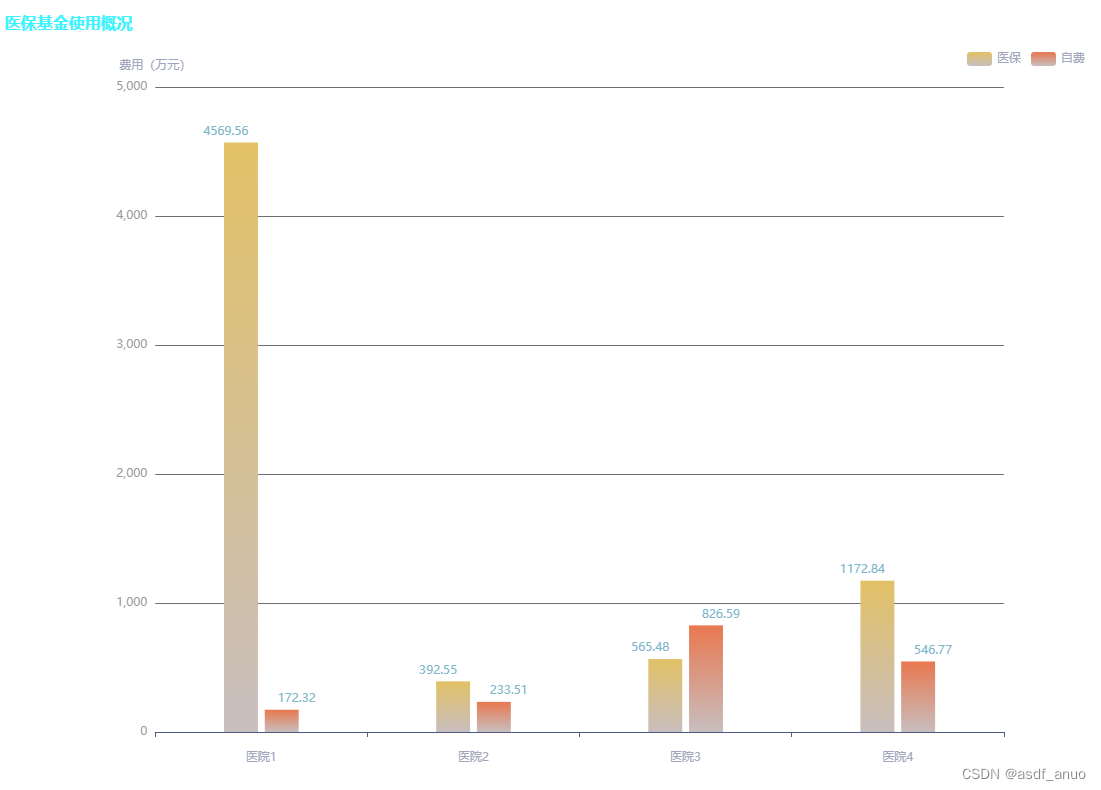
【echart】柱状图的阴影渐变和顶部展示value和字体颜色等设置

在这里插入图片描述

需要的效果:柱状图的渐变色设置
遇到的问题:根据官网写的没有生效
在这里插入图片描述

解决方式步骤如下:
1.首先写一个公用方法

drawChart(id, option) {
      let myChart = this.$echarts.init(document.getElementById(id));
      myChart.setOption(option);
},

2.获取地图数据的方法:

initChart() {
  let option = {
        color: ["#e2c166", "#e8784f", "#f6f7ea"],
        title: {
          text: "医保基金使用概况",
          left: 10,
          top: 5,
          textStyle: {
            color: "#3CF3FF",
            fontSize: 16
          }
        },
        grid: {
          top: 80,
          bottom: 50,
          left: "15%",
          right: "8%"
        },
        tooltip: {
          trigger: "axis",
          axisPointer: {
            type: "cross",
            crossStyle: {
              color: "#999"
            },
            label: {
              formatter: function(params) {
                let value = params.value;
                if (typeof value === "number") {
                  return value.toFixed(2);
                }
              }
            }
          }
        },
        legend: {
          top: 40,
          right: 2,
          textStyle: {
            color: "#a1a6bd",
            fontSize: '12px'
          },
          data: ["医保", "自费"]
        },
        xAxis: [
          {
            type: "category",
            data: ["医院1","医院2","医院3","医院4"],
            axisLabel: {
              margin: 20,
              color: "#a1a6bd"
            },
            axisPointer: {
              type: "shadow"
            },
            axisLine: {
              lineStyle: {
                color: "#505a87"
              }
            }
          }
        ],
        yAxis: [
          {
            type: "value",
            name: "费用(万元)",
            nameTextStyle: {
              color: "#a1a6bd"
            },
            axisLine: {
              lineStyle: {
                color: "#999"
              }
            },
            splitLine: {
              lineStyle: {
                color: "transprent"
              }
            }
          }
        ],
        series: [
          {
            name: "医保"
            type: "bar",
            barWidth: "16%",
            label: {
              show: true,
              position: "top",
              // rotate: 15,
              offset: [-15, 0],
              color: "#7fb6c9",
              formatter: function(params) {
                return params.value;
              }
            },
            itemStyle: {
              normal: {
                color: {
                  type: "linear",
                  x: 0,
                  y: 0,
                  x2: 0,
                  y2: 1,
                  colorStops: [
                    {
                      offset: 1,
                      color: "rgb(200,190,190)"
                    },
                    {
                      offset: 0,
                      color: "#e2c166"
                    }
                  ]
                }
              }
            },
            // stack: "基金使用情况",
            data: [4569.56,392.55,565.48,1172.84]
          },
          {
            name: "自费",
            type: "bar",
            barWidth: "16%",
            label: {
              show: true,
              position: "top",
              // rotate: 15,
              offset: [15, 0],
              color: "#7fb6c9",
              formatter: function(params) {
                return params.value;
              }
            },
            itemStyle: {
              normal: {
                color: {
                  type: "linear",
                  x: 0,
                  y: 0,
                  x2: 0,
                  y2: 1,
                  colorStops: [
                    {
                      offset: 1,
                      color: "rgb(200,190,190)"
                    },
                    {
                      offset: 0,
                      color: "#e8784f"
                    }
                  ]
                }
              }
            },
            // stack: "基金使用情况",
            data: [172.32,233.51,826.59,546.77]
          }
        ]
      }
   this.drawChart("myChartBoxId", option);
}

3.html和css的代码如下:

<div id="healthRes"></div>

#healthRes {
  width: 100%;
  height: 100%;
}

最后的效果如下:
在这里插入图片描述

在这里插入图片描述

  • 0
    点赞
  • 0
    收藏
    觉得还不错? 一键收藏
  • 0
    评论

“相关推荐”对你有帮助么?

  • 非常没帮助
  • 没帮助
  • 一般
  • 有帮助
  • 非常有帮助
提交
评论
添加红包

请填写红包祝福语或标题

红包个数最小为10个

红包金额最低5元

当前余额3.43前往充值 >
需支付:10.00
成就一亿技术人!
领取后你会自动成为博主和红包主的粉丝 规则
hope_wisdom
发出的红包
实付
使用余额支付
点击重新获取
扫码支付
钱包余额 0

抵扣说明:

1.余额是钱包充值的虚拟货币,按照1:1的比例进行支付金额的抵扣。
2.余额无法直接购买下载,可以购买VIP、付费专栏及课程。

余额充值