【ReactEcharts】饼图常规案例实现

详细配置项可跳转至我的文章 ReactEcharts常见基础配置项解析

代码实现

import React from 'react';
import ReactEcharts from 'echarts-for-react';
import * as echarts from 'echarts';

export default function PieEcharts(props) {
    const { dataList, nameList } = props;
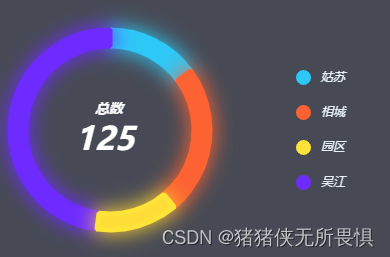
    let color = ['#2ec8f6', '#fd6232', '#fccf33', '#6d2bff'];
    const data = dataList.map((item, index) => {
        return {
            name: nameList[index],
            value: item,
            itemStyle: {
                normal: {
                    borderWidth: 5,
                    shadowBlur: 20,
                    borderColor: color[index],
                    shadowColor: color[index],
                },
            },
        };
    });
    let option = {
        backgroundColor: 'transparent',
        color: color,
        selectedOffset: 10, //选中扇区的偏移距离。
        stillShowZeroSum: true, // 是否在数据和为0(一般情况下所有数据为0) 的时候仍显示扇区。
        percentPrecision: 2, //饼图百分比数值的精度,默认保留小数点后两位。

        itemStyle: {
            borderWidth: 2,
            borderColor: '#FFF',
            borderCap: 'butt', // 方形 round:圆形
        },
        tooltip: {
            show: true,
        },
        title: {
            text: `{a|总数}\n{b|${dataList?.[0]}}`,
            x: '20%',
            y: 'center',
            textStyle: {
                rich: {
                    a: {
                        fontSize: 14,
                        color: '#fff',
                        fontWeight: '600',
                        fontStyle: 'italic',
                        padding: [5, 20],
                    },
                    b: {
                        fontSize: 32,
                        color: '#fff',
                        fontWeight: '600',
                        fontStyle: 'italic',
                        padding: [5, 0],
                    },
                },
            },
        },
        legend: {
            show: true,
            orient: 'vertical',
            data: nameList,
            right: '10%',
            top: 'center',
            align: 'left',
            textStyle: {
                color: '#EDF5FF',
                fontWeight: 400,
                fontStyle: 'italic',
            },
            itemGap: 20,
            formatter: params => {
                return `${params}`;
            },
            icon: 'pin',
        },
        toolbox: {
            show: false,
        },
        series: [
            {
                type: 'pie',
                radius: ['42%', '50%'],
                center: ['30%', '50%'],
                data: data,
                label: {
                    show: false,
                    position: 'outside', // 标签的位置 -- inside:内侧  center:中心
                    formatter: '{a|系列名}\n{b|数据名}\n{c|数据值}\n{d|百分比}',
                    rich: {
                        a: {
                            color: '#23a',
                        },
                        b: {
                            color: '#a23',
                        },
                        c: {
                            color: '#a2a',
                        },
                        d: {
                            color: '#cc2',
                        },
                    },
                    fontSize: 12,
                    backgroundColor: new echarts.graphic.LinearGradient(0, 0, 0, 1, [
                        {
                            offset: 0,
                            color: 'rgba(22,178,251,0.8)',
                        },
                        {
                            offset: 1,
                            color: 'rgba(139, 185, 255, 0.01)',
                        },
                    ]),
                },
                labelLine: {
                    show: false,
                },
                showEmptyCircle: true, // 是否在无数据的时候显示一个占位圆
                emptyCircleStyle: {
                    // 占位圆样式
                    color: '#ccc',
                    borderColor: '#fff',
                    borderWidth: 5,
                    opacity: 1, // 支持0-1 0的时候隐藏
                },
            },
        ],
    };
    return (
        <ReactEcharts
            option={option}
            notMerge
            lazyUpdate
            style={{ height: '400px', width: '400px' }}
        />
    );
}


效果图

在这里插入图片描述

  • 0
    点赞
  • 0
    收藏
    觉得还不错? 一键收藏
  • 0
    评论

“相关推荐”对你有帮助么?

  • 非常没帮助
  • 没帮助
  • 一般
  • 有帮助
  • 非常有帮助
提交
评论
添加红包

请填写红包祝福语或标题

红包个数最小为10个

红包金额最低5元

当前余额3.43前往充值 >
需支付:10.00
成就一亿技术人!
领取后你会自动成为博主和红包主的粉丝 规则
hope_wisdom
发出的红包
实付
使用余额支付
点击重新获取
扫码支付
钱包余额 0

抵扣说明:

1.余额是钱包充值的虚拟货币,按照1:1的比例进行支付金额的抵扣。
2.余额无法直接购买下载,可以购买VIP、付费专栏及课程。

余额充值