


需引用最新的最新4.2版本的js(<script src="echarts.min.js"></script>)
1.柱状图
var myChart = echarts.init(document.getElementById('todayRole'));
    var dataAxis = ['物业管理','住户','陌生人','黑名单','租户'];
    var data = [2, 16, 27, 2, 16];
    var yMax = 50;
    var dataShadow = [];

    for (var i = 0; i < data.length; i++) {
        dataShadow.push(yMax);
    }
    option = {
        title: {
            text: '今日角色访问统计',
            textStyle: {
                color: '#999',
                fontSize: 15
            }
        },
        tooltip : {
            trigger: 'axis',
            axisPointer : {            // 坐标轴指示器,坐标轴触发有效
                type : 'shadow'        // 默认为直线,可选为:'line' | 'shadow'
            }
        },
        xAxis: {
            data: dataAxis,
            axisLabel: {
                // inside: true,
                textStyle: {
                    color: '#999'
                },
                interval:0,//显示所有的类别
            },
            axisTick: {
                show: false
            },
            axisLine: {
                show: false
            },
            z: 10
        },
        yAxis: {
            axisLine: {
                show: false
            },
            axisTick: {
                show: false
            },
            axisLabel: {
                textStyle: {
                    color: '#999'
                }
            }
        },
        series: [
            { // For shadow
                type: 'bar',
                itemStyle: {
                    normal: {color: 'rgba(0,0,0,0.05)'}
                },
                barGap:'-100%',
                barCategoryGap:'60%',
                data: dataShadow,
                animation: false
            },
            {
                type: 'bar',
                itemStyle: {
                    normal: {
                        color: new echarts.graphic.LinearGradient(
                            0, 0, 0, 1,
                            [
                                {offset: 0, color: '#83bff6'},
                                {offset: 0.5, color: '#188df0'},
                                {offset: 1, color: '#188df0'}
                            ]
                        )
                    },
                    emphasis: {
                        color: new echarts.graphic.LinearGradient(
                            0, 0, 0, 1,
                            [
                                {offset: 0, color: '#2378f7'},
                                {offset: 0.7, color: '#2378f7'},
                                {offset: 1, color: '#83bff6'}
                            ]
                        )
                    }
                },
                data: data
            }
        ]
    };

2.折线图
option = {
        title: {
            text: '过去一周访问次数趋势图',
            top: 10,
            textStyle: {
                color: '#999',
                fontSize: 15
            }
        },
        tooltip : {
            trigger: 'axis'
        },
        xAxis : [
            {
                type : 'category',
                boundaryGap : false,
                data : ["03-20", "03-21", "03-22"],
                axisLabel: {
                    textStyle: {
                        color: '#999',//坐标值得具体的颜色

                    }
                }
            }
        ],
        yAxis : [
            {
                type : 'value',
                axisLabel: {
                    textStyle: {
                        color: '#999',//坐标值得具体的颜色

                    }
                }
            }
        ],
        series : [
            {
                name:'访问次数',
                type:'line',
                smooth:true,
                itemStyle: {
                    normal: {
                        areaStyle: {
                            type: 'default'
                        },
                        color:'#c43fc4'
                    }
                },
                data:[11, 147, 67]
            }
        ]
    };

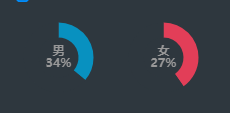
3.环形图
var radius = [20, 35];
    option = {
        series: [{
            type: 'pie',
            radius: radius,
            center : ['25%', '45%'],
            color:['#48a4dad3','#2c343c'],
            avoidLabelOverlap: false,
            hoverAnimation:false,
            label: {
                normal: {
                    show: false,
                    position: 'center',
                    textStyle: {
                        fontSize: 12,
                        fontWeight: 'bold',
                        color:'#999'
                    },
                    formatter:'{b}\n{c}%'
                }
            },
            data: [{
                value: 36,
                name: "男",
                label:{
                    normal:{
                        show:true
                    }
                }
            },{
                value: 100-40,
                name: ''
            }]
        },{
            type: 'pie',
            radius: radius,
            center : ['75%', '45%'],
            color:['#ee4f69d3','#2c343c'],
            avoidLabelOverlap: false,
            hoverAnimation:false,
            label: {
                normal: {
                    show: false,
                    position: 'center',
                    textStyle: {
                        fontSize: 12,
                        fontWeight: 'bold',
                        color:'#999'
                    },
                    formatter:'{b}\n{c}%'
                }
            },
            data: [{
                value: 31,
                name: "女",
                label:{
                    normal:{
                        show:true
                    }
                }
            },{
                value: 100-60,
                name: ''
            }]
        }]
    };
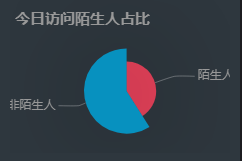
4.饼状图
 option = {
        title: {
            text: '今日访问陌生人占比',
            top: 10,
            textStyle: {
                color: '#999',
                fontSize: 15
            }
        },
        tooltip : {
            trigger: 'item',
            formatter: "{b} : {c} ({d}%)"
        },
        series : [
            {
                type:'pie',
                radius : '55%',
                center: ['53%', '60%'],
                data:[
                    {
                        value:40,
                        name:'陌生人',
                        itemStyle: {
                            color: '#ee4f69d3'
                        }
                    },
                    {
                        value:60,
                        name:'非陌生人',
                        itemStyle: {
                            color: '#48a4dad3'
                        }
                    },
                ].sort(function (a, b) { return a.value - b.value; }),
                roseType: 'radius',
                label: {
                    normal: {
                        textStyle: {//文字颜色
                            color: '#999'
                        }
                    }
                },
                labelLine: {
                    normal: {
                        lineStyle: {
                            color: 'rgba(255, 255, 255, 0.3)'
                        },
                        smooth: 0.2,
                        length: 10,
                        length2: 20
                    }
                },
                itemStyle: {
                    normal: {
                        color: '#c23531',
                        shadowBlur: 200,
                        shadowColor: 'rgba(0, 0, 0, 0.5)',// 阴影颜色
                        label: {
                            show: true,
                            position: 'top'
                        }
                    }
                },
                animationType: 'scale',
                animationEasing: 'elasticOut',
                animationDelay: function (idx) {
                    return Math.random() * 200;
                }
            }
        ]
    };


 54
54


 被折叠的 条评论
为什么被折叠?
被折叠的 条评论
为什么被折叠?
 到【灌水乐园】发言


