


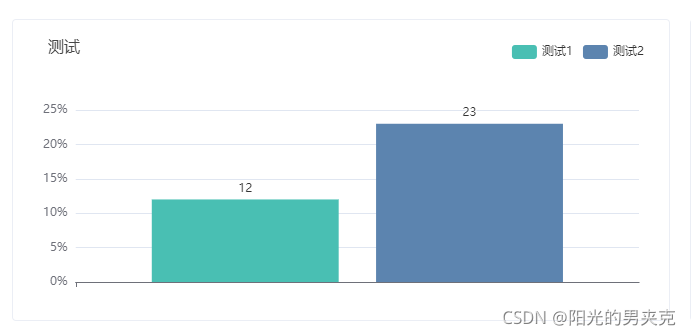
效果如下,每个柱子设置了不同的图例
<div id="mainTopLeft" style="width: 100%;height:300px;"></div>
optionTopLeft() {
      let bar_data = [12,23]; //模拟数据
      // 通过id获取获取画布
      const myChart = echarts.init(document.getElementById('mainTopLeft'));
      // 指定图表的配置项和数据
      let option = {
        title: {
          text: '测试',
          textStyle: {
            fontWeight: 'normal',
            fontSize:16,
          },
          left:30,
          top:15,
        },
        legend: {
          orient: 'vertical', // 'horizontal'
          data:['测试1','','测试2'],
          textStyle: {  // 图列内容样式
            // color: '#fff',  // 字体颜色
          },
          top:20,
          right:20
        },
        grid: {
          left: 30,
          right: 30,
          top: '30%',
          bottom:'10%',
          containLabel: true
        },
        tooltip : {
          formatter: '{a}:{c}%'//a 是series中每条数据name值,c 是data数值
        },
        xAxis : [ //横坐标
          {
            type : 'category',
            data:[''],
            containLabel: true
          }
        ],
        yAxis : [ //纵坐标
          {
            type : 'value',
            axisLabel: {
              show:true,
              //Y轴数值可添加百分号
              formatter: '{value}%',
            },
          }
        ],
        color:['#49BFB3','#5C84AF'],//柱状图的颜色
        series : [
          {name:'测试1'},
          {name:'测试2'},
        ],
      };
      for(let i = 0; i< option.series.length; i++){
        let style = { //定义柱状图的样式
          normal: {
            label: {
              show: true,
              //柱子上方显示数值
              position: 'top',
              //数值可加上'%'
              formatter: '{c}'
            }
          }
        };
        //每条数据指定类型为'bar'
        option.series[i].type = 'bar';
        // series中每条数据都加的样式
        option.series[i].itemStyle = style;
        //series 中 data赋值
        option.series[i].data = [bar_data[i]];
      };
      // 使用刚指定的配置项和数据显示图表。画布为 myCharts  true为显示
      if (option && typeof option === "object") {
        myChart .setOption(option, true);
      }
    },


 6510
6510


 被折叠的 条评论
为什么被折叠?
被折叠的 条评论
为什么被折叠?
 到【灌水乐园】发言


