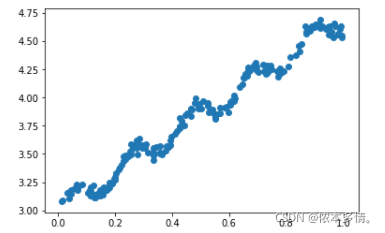
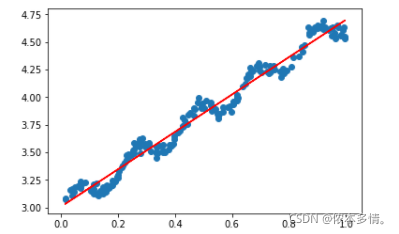
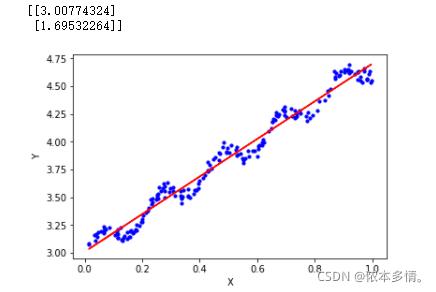
01.根据数据集ex0.txt,画出样本点。并根据线性回归画出拟合直线。
注:可以采用sklearn里面的线性回归算法也可以自己写线性回归算法
import numpy as np
import matplotlib.pyplot as plt
dataSet=np.genfromtxt('ex0.txt')
x_data=dataSet[:,:-1]
y_data=dataSet[:,-1]
def plot():
plt.scatter(x_data[:,1],y_data)
plot()
plt.show()
def standRegres(xArr,yArr):
xMat=np.mat(xArr)
yMat=np.mat(yArr).T
xTx=xMat.T*xMat
if np.linalg.det(xTx) == 0.0:
print("这个矩阵是奇异矩阵,矩阵不可逆")
return
ws=(xTx).I*(xMat.T*yMat)
return ws
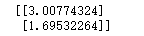
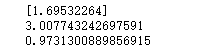
ws=standRegres(x_data,y_data)
print(ws)
yHat=x_data*ws
plt.plot(x_data[:,1],yHat,c='r')
plot()
plt.show()
import numpy as np
import matplotlib.pyplot as plt
dataSet = np.genfromtxt('ex0.txt')
x_data=dataSet[:,:-1]
y_data=dataSet[:,-1]
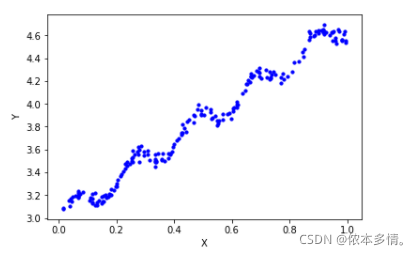
def plot():
plt.scatter(x_data[:,1],y_data,c='blue',s=10)
plt.xlabel('X')
plt.ylabel('Y')
plot()
plt.show()
from sklearn.linear_model import LinearRegression
LR=LinearRegression()
XData=x_data[:,1,np.newaxis]
LR.fit(XData,y_data)
print(LR.coef_)
print(LR.intercept_)
print(LR.score(XData,y_data))
ws=np.zeros((2,1))
ws[0]=LR.intercept_
ws[1]=LR.coef_
print(ws)
yHat=np.mat(x_data)*ws
plot()
import matplotlib.pyplot as plt
plt.plot(x_data[:,1],yHat,'r')
plt.show()
import mglearn
from sklearn.linear_model import LinearRegression
from sklearn.model_selection import train_test_split
X,y=mglearn.datasets.load_extended_boston()
X_train,X_test,y_train,y_test=train_test_split(X,y)
lr=LinearRegression().fit(X_train,y_train)
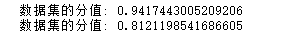
print("数据集的分值:",lr.score(X_train,y_train))
print("数据集的分值:",lr.score(X_test,y_test))


 这篇博客介绍了如何使用Python的numpy和matplotlib库进行线性回归分析,包括读取数据、绘制样本点、实现线性回归算法以及用sklearn库进行拟合。博主通过实例展示了如何画出拟合直线,并对比了自定义算法与sklearn库的结果。同时,还应用到波士顿房价数据集来展示线性回归在实际问题中的应用。


 5120
5120

 被折叠的 条评论
为什么被折叠?
被折叠的 条评论
为什么被折叠?
 到【灌水乐园】发言


