from mpl_toolkits.mplot3d import Axes3D
import matplotlib.pyplot as plt
import numpy as np
from matplotlib import cm
fig = plt.figure()
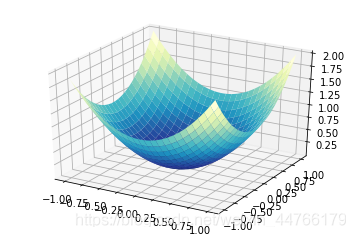
ax = fig.add_subplot(111, projection='3d')
u = np.linspace(-1, 1, 100)
x, y = np.meshgrid(u, u)
z = x**2 + y**2
ax.plot_surface(x, y, z, rstride=4, cstride=4, cmap=cm.YlGnBu_r)
plt.show()
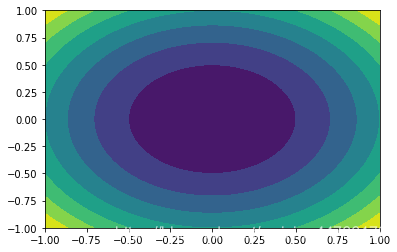
# 等高线图
import matplotlib.pyplot as plt
import numpy as np
from matplotlib import cm

fig = plt.figure()
ax = fig.add_subplot(111)

u = np.linspace(-1, 1, 100)

x, y = np.meshgrid(u, u)
z = x**2 + y**2

ax.contourf(x, y, z)

plt.show()
import numpy as np
import matplotlib.pyplot as plt
import matplotlib.animation as animation
fig = plt.figure()
ax = fig.add_subplot(111)
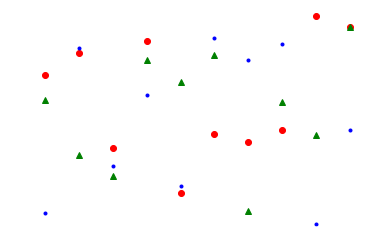
N = 10
x = np.random.rand(N)
y = np.random.rand(N)
z = np.random.rand(N)
circles, triangles, dots = ax.plot(x, 'ro', y, 'g^', z, 'b.')
ax.set_ylim(0, 1)
plt.axis('off')
def update(data):
circles.set_ydata(data[0])
triangles.set_ydata(data[1])
return circles, triangles
def generated():
while True: yield np.random.rand(2, N)
anim = animation.FuncAnimation(fig, update, generated, interval=150)
plt.show()
import numpy as np
import matplotlib.mlab as mlab
import matplotlib.pyplot as plt
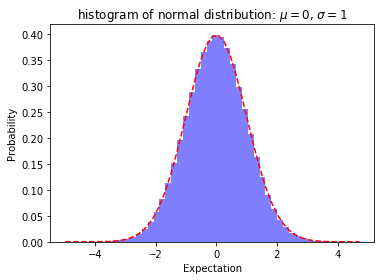
mu, sigma , num_bins = 0, 1, 50
x = mu + sigma * np.random.randn(1000000)
# 正态分布的数据
n, bins, patches = plt.hist(x, num_bins, normed=True, facecolor = 'blue', alpha = 0.5)
# 拟合曲线
y = mlab.normpdf(bins, mu, sigma)
plt.plot(bins, y, 'r--')
plt.xlabel('Expectation')
plt.ylabel('Probability')
plt.title('histogram of normal distribution: $\mu = 0$, $\sigma=1$')
plt.subplots_adjust(left = 0.15)
plt.show()


 4140
4140


 被折叠的 条评论
为什么被折叠?
被折叠的 条评论
为什么被折叠?
 到【灌水乐园】发言


