


使用echarts画折线图问题:
-
从新画图时,前一次的还在:
解决:setOption第二个参数传true -
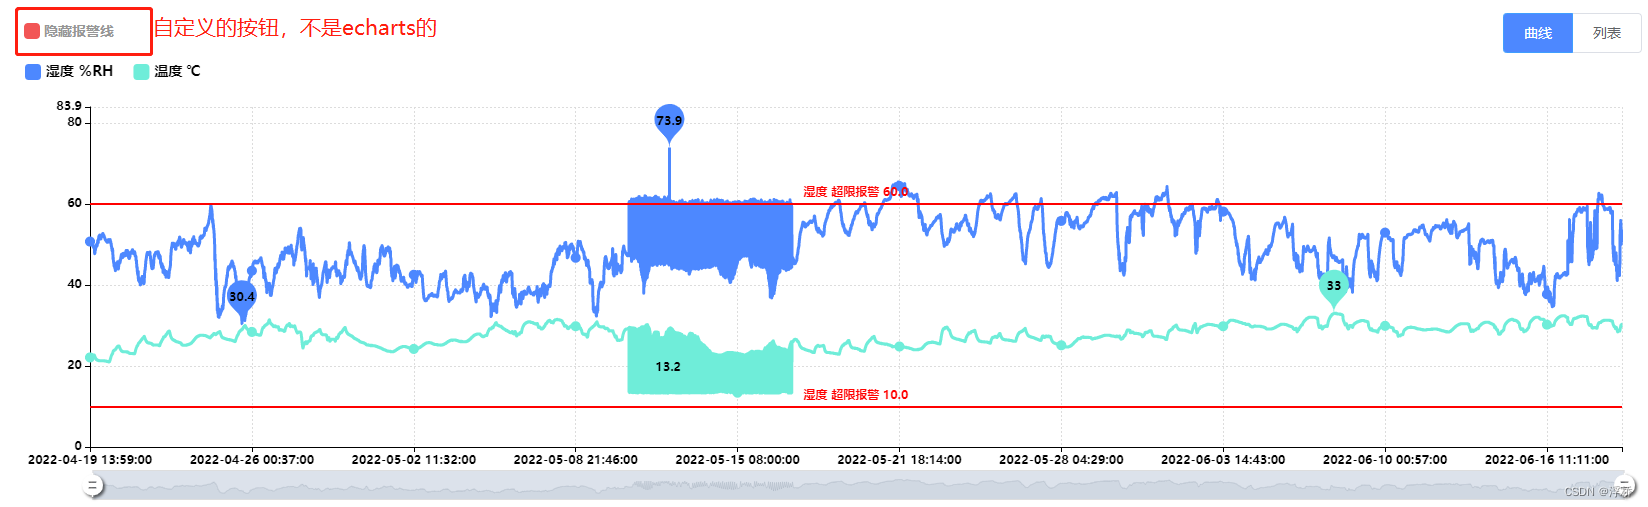
手动隐藏显示报警线
// 报警线开关 LGKEYSW
        lgkeysw() {
            this.alarmLine = !this.alarmLine
            if (!this.alarmLine) {
                this.chartOption.series.forEach((item) => {
                    item.markLine.label.show = false
                    item.markLine.lineStyle.opacity = 0
                })
            } else {
                this.chartOption.series.forEach((item) => {
                    item.markLine.label.show = true
                    item.markLine.lineStyle.opacity = 1
                })
            }
            this.myEcharts.setOption(this.chartOption, true)
        },
由于数据量大的时候会出现十几二十秒的反应时间,修改代码解决bug
// 报警线开关 LGKEYSW
        lgkeysw(showAlarmBtn) {
            if (!this.alarmBtn) {
                return false
            }

            this.alarmLine = !showAlarmBtn
            let series = []
            if (!this.alarmLine) {
                this.chartOption.series.forEach((item) => {
                    series.push({
                        markLine: {
                            label: {
                                show: false
                            },
                            lineStyle: {
                                opacity: 0
                            }
                        }
                    })
                })
            } else {
                this.chartOption.series.forEach((item) => {
                    series.push({
                        markLine: {
                            label: {
                                show: true
                            },
                            lineStyle: {
                                opacity: 1
                            }
                        }
                    })
                })
            }
            this.myEcharts.setOption(
                {
                    series: series
                },
                { replaceMerge: 'series' }
            )
        },
效果:


 662
662


 被折叠的 条评论
为什么被折叠?
被折叠的 条评论
为什么被折叠?
 到【灌水乐园】发言


