


目录
一、柱状图、条形图、直方图

1、柱状图


2、条形图


3 、直方图


二、气泡图 、棉棒图
1、气泡图


2 、棉棒图


三、箱线图 、极线图
1 、箱线图


2、极线图


四、误差棒图


五、饼图
plt.rcParams['font.family']='FangSong'
# 生成数据
labels = ['A', 'B', 'C', 'D', '其他']
share = [0.45, 0.25, 0.15, 0.05, 0.10]

# 设置分裂属性
explode = [0, 0.1, 0, 0, 0]

# 分裂饼图
plt.pie(share, explode = explode,
        labels = labels, autopct = '%3.1f%%',
        startangle = 180, shadow = True,
        colors = ['c', 'r', 'gray', 'g', 'y'])

# 标题
plt.title('2019年笔记本电脑市场份额')
plt.savefig(r'C:\Users\young\Desktop\test1.jpg',dpi=200)
plt.show()
plt.rcParams['font.family']='FangSong'

# 设置图片大小
plt.figure(figsize = (10, 8))

# 生成数据
labels = ['A', 'B', 'C', 'D', '其他']
share_laptop = [0.45, 0.25, 0.15, 0.05, 0.10] #便携式笔记本
share_pc = [0.35, 0.35, 0.08, 0.07, 0.15] #所有计算机(包括台式机)
colors = ['c', 'r', 'y', 'g', 'gray']

# 外环
wedges1, texts1, autotexts1 = plt.pie(share_laptop,
    autopct = '%3.1f%%',
    radius = 1,
    pctdistance = 0.85,
    colors = colors,
    startangle = 180,
    textprops = {'color': 'w'},
    wedgeprops = {'width': 0.3, 'edgecolor': 'w'}
)

# 内环
wedges2, texts2, autotexts2 = plt.pie(share_pc,
    autopct = '%3.1f%%',
    radius = 0.7,
    pctdistance = 0.75,
    colors = colors,
    startangle = 180,
    textprops = {'color': 'w'},
    wedgeprops = {'width': 0.3, 'edgecolor': 'w'}
)

# 图例
plt.legend(wedges1,
          labels,
          fontsize = 12,
          title = '公司列表',
          loc = 'center right',
          bbox_to_anchor = (1.1, 0.8))

# 设置文本样式
plt.setp(autotexts1, size=15, weight='bold')
plt.setp(autotexts2, size=15, weight='bold')

# 标题
plt.title('2019年笔记本及PC电脑市场份额', fontsize=20)

plt.annotate("笔记本行业",xy=(-0.6,-0.6),xytext=(-1.2,-1.2),weight="bold",color="b",\
             arrowprops=dict(arrowstyle="->",connectionstyle="arc3",color="y"))
plt.annotate("PC",xy=(-0.4,-0.4),xytext=(-1.5,-1),weight="bold",color="b",\
             arrowprops=dict(arrowstyle="->",connectionstyle="arc3",color="y"))
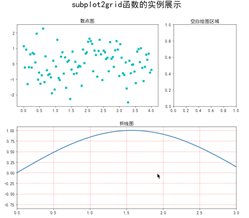
六 、子图划分


1 、

2 、

3 、

4、

七、Artist对象 、子图的图形样式(坐标轴 、刻度线、注解的设置等


八、marines和小栗子


 2万+
2万+


 被折叠的 条评论
为什么被折叠?
被折叠的 条评论
为什么被折叠?
 到【灌水乐园】发言


