


import pandas as pd

(1)Series类型

1.Series类型的创建方法
#series类型的创建方法:
import numpy as np
import pandas as pd

a=pd.Series([9,8,7,6])
b=pd.Series([9,8,7,6],index=['a','b','c','d'])
c=pd.Series(25,index=['a','b','c'])
d=pd.Series({'a':9,'b':8,'c':7})
e=pd.Series({'a':9,'b':8,'c':7},index=['c','a','b','d'])
f=pd.Series(np.arange(5))
g=pd.Series(np.arange(5),index=np.arange(9,4,-1))
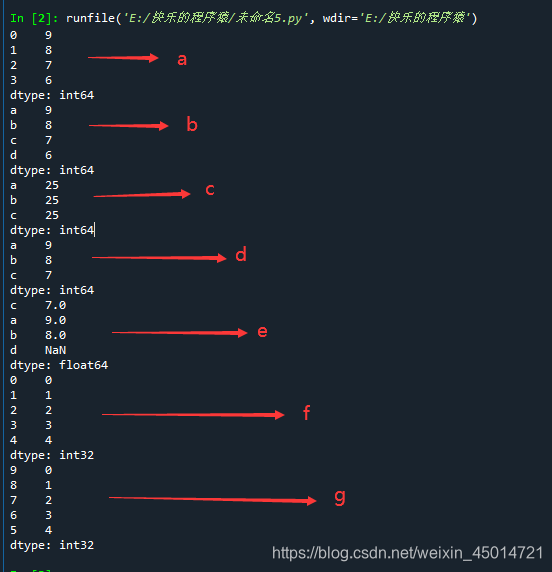
总之,创建Series要么是pd.Series([列表1],index=[列表二]);
要么是pd.Series({'a':9,'b':8,'c':7,'d':6})这种的。
这里的列表既可以是np.arange(9,4,-1),也可以是[9,8,7,6]这种的。
2.Series类型的基本操作
import pandas as pd
b=pd.Series([9,8,7,6],['a','b','c','d'])

b
b.values
b.index

b[1]
b['b']
b[['c','d','a']]
b[['c','d','a']] = 10

b[3]
b[:3]

b[b>b.median()]
np.exp(b)  #exp(a)就是e的a次方

b.get('f',100)  #如果f在b里面,返回索引f对应的值;如果f不在b里面,那就返回100
import pandas as pd
b=pd.Series([9,8,7,6],['a','b','c','d'])

b.name='Series对象'
b.index.name='索引列'

'''
索引列
a    9
b    8
c    7
d    6
Name: Series对象, dtype: int64
'''
import pandas as pd
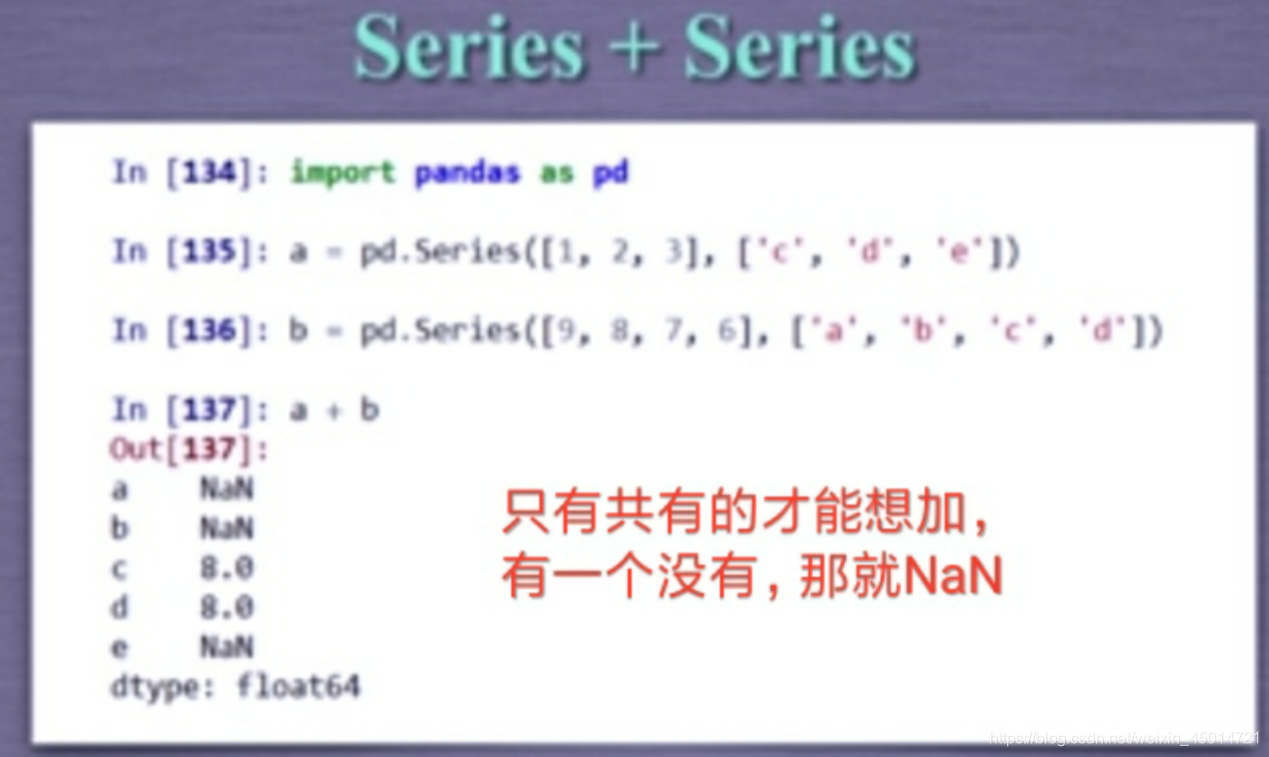
a=pd.Series([1,2,3],['c','d','e'])
b=pd.Series([9,8,7,6],['a','b','c','d'])
>>> b
a 9
b 8
c 7
d 6
dtype: int64
>>> a
c 1
d 2
e 3
dtype: int64
>>> a + b #只有a和b都有的才能相加,有一个没有那就是NaN
a NaN
b NaN
c 8.0
d 8.0
e NaN
dtype: float64
上面操作的具体输出如下:(可看可不看)
import pandas as pd
b=pd.Series([9,8,7,6],['a','b','c','d'])

>>> b
a    9
b    8
c    7
d    6
dtype: int64
>>> b.index # Series内部建立的类型
Index(['a', 'b', 'c', 'd'], dtype='object')
>>> b.values
array([9, 8, 7, 6], dtype=int64)
>>> b['b']
8
>>> b[1] # 即使指定索引,自动索引仍然存在
8
# b[['c', 'd', 0]] 目前已经不再支持这种混合使用的用法
>>> b[['c', 'd', 'a']]
c    7
d    6
a    9
dtype: int64


>>> b[3]
6
>>> b[:3]
a    9
b    8
c    7
dtype: int64


>>> b[b>b.median()]
a    9
b    8
dtype: int64
>>> np.exp(b)
a    8103.083928
b    2980.957987
c    1096.633158
d     403.428793
dtype: float64


>>> b.get('f', 100)
100
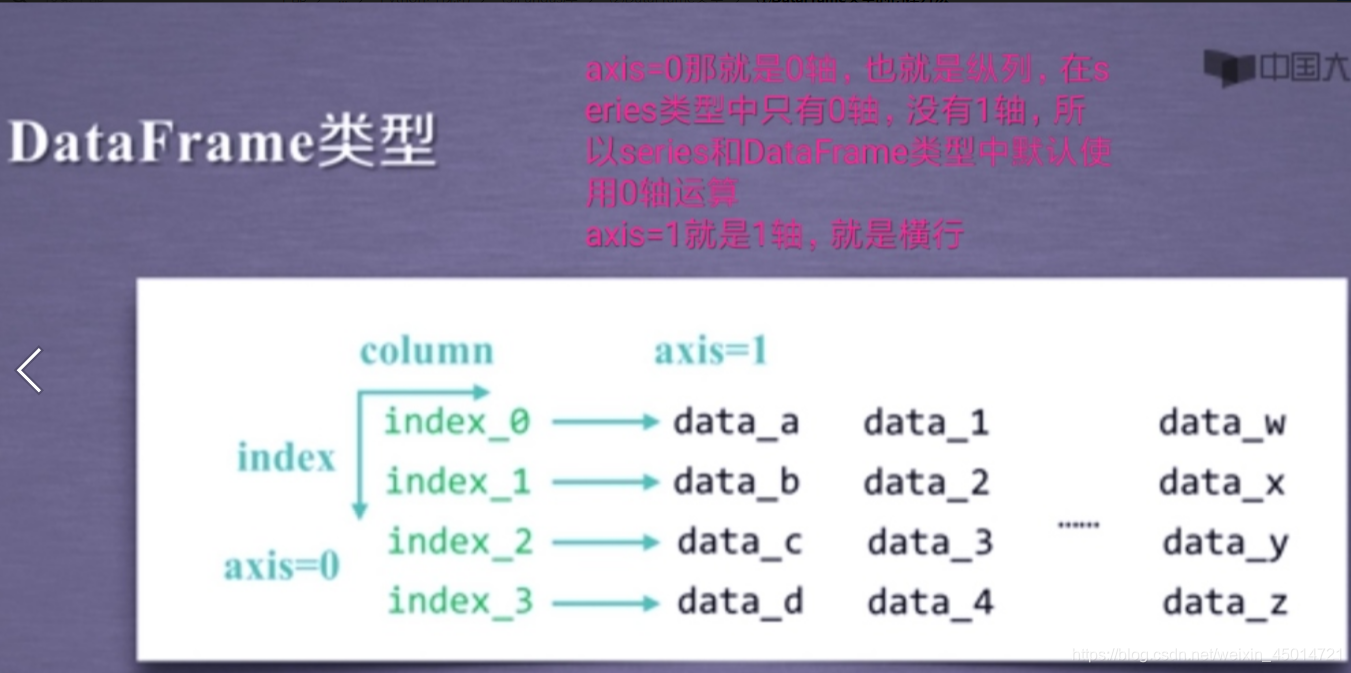
2.DataFrame类型
DataFrame类型和series类型是兄弟
1.DataFrame类型的创建方法
import pandas as pd
import numpy as np

a=pd.DataFrame(np.arange(10).reshape(2,5))
'''
   0  1  2  3  4
0  0  1  2  3  4
1  5  6  7  8  9
'''

dt={
   'one':pd.Series([1,2,3],index=['a','b','c']),
   'two':pd.Series([9,8,7,6],index=['a','b','c','d'])
   }
b=pd.DataFrame(dt)
c=pd.DataFrame(dt,index=['b','c','d'],columns=['two','three'])
'''
dt就是一个普通的字典:                 而b就是一个DataFrame:      c也是一个DataFrame:
{'one'                                  one  two                     two three
a    1                               a  1.0    9                 b    8   NaN
b    2                               b  2.0    8                 c    7   NaN
c    3                               c  3.0    7                 d    6   NaN
dtype: int64,                        d  NaN    6

'two':
a    9
b    8
c    7
d    6
dtype: int64}
'''

dt2={'one':[1,2,3,4],'two':[9,8,7,6]}
d=pd.DataFrame(dt2,index=['a','b','c','d'])
'''
dt2就是一个普通的字典:{'one': [1, 2, 3, 4], 'two': [9, 8, 7, 6]}

而d就是:
   one  two
a    1    9
b    2    8
c    3    7
d    4    6
'''
2.DataFrame可以直接输出来的属性

import pandas as pd

d1={'城市':['北京','上海','广州','深圳','沈阳'],
    '环比':[101.5,101.2,101.3,102.0,100.1],
    '同比':[120.7,127.3,119.4,140.9,101.4],
    '定基':[121.4,127.8,120.0,145.5,101.6]}
d=pd.DataFrame(d1,index=['c1','c2','c3','c4','c5'])


d.index
'''Index(['c1', 'c2', 'c3', 'c4', 'c5'], dtype='object')'''
d.columns
'''Index(['城市', '环比', '同比', '定基'], dtype='object')'''
d.values
'''
array([['北京', 101.5, 120.7, 121.4],
       ['上海', 101.2, 127.3, 127.8],
       ['广州', 101.3, 119.4, 120.0],
       ['深圳', 102.0, 140.9, 145.5],
       ['沈阳', 100.1, 101.4, 101.6]], dtype=object)

'''
d
'''
    城市  环比   同比    定基
c1  北京  101.5  120.7  121.4
c2  上海  101.2  127.3  127.8
c3  广州  101.3  119.4  120.0
c4  深圳  102.0  140.9  145.5
c5  沈阳  100.1  101.4  101.6
'''
import pandas as pd

d1={'城市':['北京','上海','广州','深圳','沈阳'],
    '环比':[101.5,101.2,101.3,102.0,100.1],
    '同比':[120.7,127.3,119.4,140.9,101.4],
    '定基':[121.4,127.8,120.0,145.5,101.6]}
frame=pd.DataFrame(d1,index=['c1','c2','c3','c4','c5'])
'''
    城市  环比   同比    定基
c1  北京  101.5  120.7  121.4
c2  上海  101.2  127.3  127.8
c3  广州  101.3  119.4  120.0
c4  深圳  102.0  140.9  145.5
c5  沈阳  100.1  101.4  101.6
'''

print(frame['同比'][0:2])  #找到某一行某一列
print(frame[0:2]['同比'])  #找到某一行某一列

print(frame['城市'])   #找到某一列
print(frame[['城市','环比']] )  #找到某一列(这里必须是两个[])

print(frame[0:2])  #找到某一行
print(frame['c2'])  #这个输出会报错!!!c2是索引,frame[]不能通过索引查询指定行

print(frame[ frame['环比']>101.3 ])
print(frame['环比']>101.3)

import pandas as pd

d1={'城市':['北京','上海','广州','深圳','沈阳'],
    '环比':[101.5,101.2,101.3,102.0,100.1],
    '同比':[120.7,127.3,119.4,140.9,101.4],
    '定基':[121.4,127.8,120.0,145.5,101.6]}
frame=pd.DataFrame(d1,index=['c1','c2','c3','c4','c5'])
'''
    城市  环比   同比    定基
c1  北京  101.5  120.7  121.4
c2  上海  101.2  127.3  127.8
c3  广州  101.3  119.4  120.0
c4  深圳  102.0  140.9  145.5
c5  沈阳  100.1  101.4  101.6
'''

print(frame.loc[['c1','c3'],['城市','环比']])  #输出指定行指定列

print(frame.loc[['城市','环比']])  ##这个输出会报错!!!frame.loc[]专门针对行索引设定的,不能查询指定列的数据

print(frame.loc[['c1','c3']])  #通过索引输出指定行的数据
print(frame[['c1','c3']])  #这个输出会报错!!!frame[]不能通过索引查询指定行


总之,
frame[]这种可以查询指定列的数据,但不能通过索引查询指定行的数据(如frame['c2']是错误的)
frame.loc[]专门针对行索引设定的,可以通过索引查询指定行的数据,但不能查询指定列的数据(如frame.loc[['城市','环比']]是错误的)

3.pandas库的数据类型操作(适用于DataFrame和Series)
(再强调一遍:同时适用于DataFrame和Series)
①重排(重新索引 reindex)
.reindex(index=None,columns=None,…)的参数
- index行自定义索引
- columns列自定义索引
- fill_value用于填充缺失值的值(fill_value=200就是把NaN替换为200)
- method填充方法(ffill向前填充也就是克隆前一行的数据,bfill向后填充也就是克隆后一行的数据)
import pandas as pd
df = pd.DataFrame({"A": [1, 2, 3], "B": [4, 5, 6]})

df
Out[1]:
   A  B
0  1  4
1  2  5
2  3  6

df.reindex(index=(1,2,3))  #重新给行索引命名
Out[2]:
     A    B
1  2.0  5.0
2  3.0  6.0
3  NaN  NaN

df.reindex(columns=("B","C"))  #重新给列索引命名
Out[3]:
   B   C
0  4 NaN
1  5 NaN
2  6 NaN
1.reindex调整行列顺序
import pandas as pd

d1={'城市':['北京','上海','广州','深圳','沈阳'],
    '环比':[101.5,101.2,101.3,102.0,100.1],
    '同比':[120.7,127.3,119.4,140.9,101.4],
    '定基':[121.4,127.8,120.0,145.5,101.6]}
d=pd.DataFrame(d1,index=['c1','c2','c3','c4','c5'])
'''
    城市  环比   同比    定基
c1  北京  101.5  120.7  121.4
c2  上海  101.2  127.3  127.8
c3  广州  101.3  119.4  120.0
c4  深圳  102.0  140.9  145.5
c5  沈阳  100.1  101.4  101.6
'''


d=d.reindex(index=['c5','c4','c3','c2','c1'])
'''
    城市   环比   同比   定基
c5  沈阳  100.1  101.4  101.6
c4  深圳  102.0  140.9  145.5
c3  广州  101.3  119.4  120.0
c2  上海  101.2  127.3  127.8
c1  北京  101.5  120.7  121.4
'''

d=d.reindex(columns=['城市','同比','环比','定基'])
'''
    城市   同比   环比   定基
c5  沈阳  101.4  100.1  101.6
c4  深圳  140.9  102.0  145.5
c3  广州  119.4  101.3  120.0
c2  上海  127.3  101.2  127.8
c1  北京  120.7  101.5  121.4
'''
2.插入行列元素
reindex可以插入行和列,而且优点是可以批量填充数值
#coding:utf-8
import pandas as pd
from pandas import DataFrame

data={'ID':['000001','000002','000003','000004','000005','000006','000007'],
      'name':['黎明','赵春怡','张福平','百利','牛玉德','姚华','李楠'],
      'gender':[True,False,True,False,True,False,True],
      'age':[16,20,18,18,17,18,16],
      'height':[1.88,1.78,1.81,1.86,1.74,1.75,1.76]
      }
frame=pd.DataFrame(data,index=['c1','c2','c3','c4','c5','c6','c7'])
print(frame)

newc = frame.columns.insert(2,'新增')  #在第2列的位置添加一个"新增的列标题"
newd = frame.reindex(columns=newc,fill_value=200)  #在NaN处填充200
print(newd)

nl=frame.index.insert(7,'c0')
#print(nl)  #Index(['c1', 'c2', 'c3', 'c4', 'c5', 'c6', 'c7', 'c0']
nd=frame.reindex(index=nl,columns=newc,fill_value=200)
print(nd)
#值得注意的是把columns=newc改成columns=newd是错误的,因为newc是frame.columns,而newd是frame

②drop删除行列元素
#coding:utf-8
import pandas as pd
from pandas import DataFrame

data={'ID':['000001','000002','000003','000004','000005','000006','000007'],
      'name':['黎明','赵春怡','张福平','百利','牛玉德','姚华','李楠'],
      'gender':[True,False,True,False,True,False,True],
      'age':[16,20,18,18,17,18,16],
      'height':[1.88,1.78,1.81,1.86,1.74,1.75,1.76]
      }
frame=pd.DataFrame(data,index=['c1','c2','c3','c4','c5','c6','c7'])

frame=frame.drop('c2',axis=0) #值得注意的是在drop中axis=0是删除行,axis=1是删除列
print(frame)

frame=frame.drop(['c5','c3'],axis=0)  #删除行;axis=0写与不写都可以,axis是默认为0的
print(frame)

frame=frame.drop('name',axis=1) #删除列
print(frame)

frame=frame.drop(  index=(  frame.loc[(frame['gender']==True)].index  )   ) #删除性别为True的行;axis是默认为0的
print(frame)

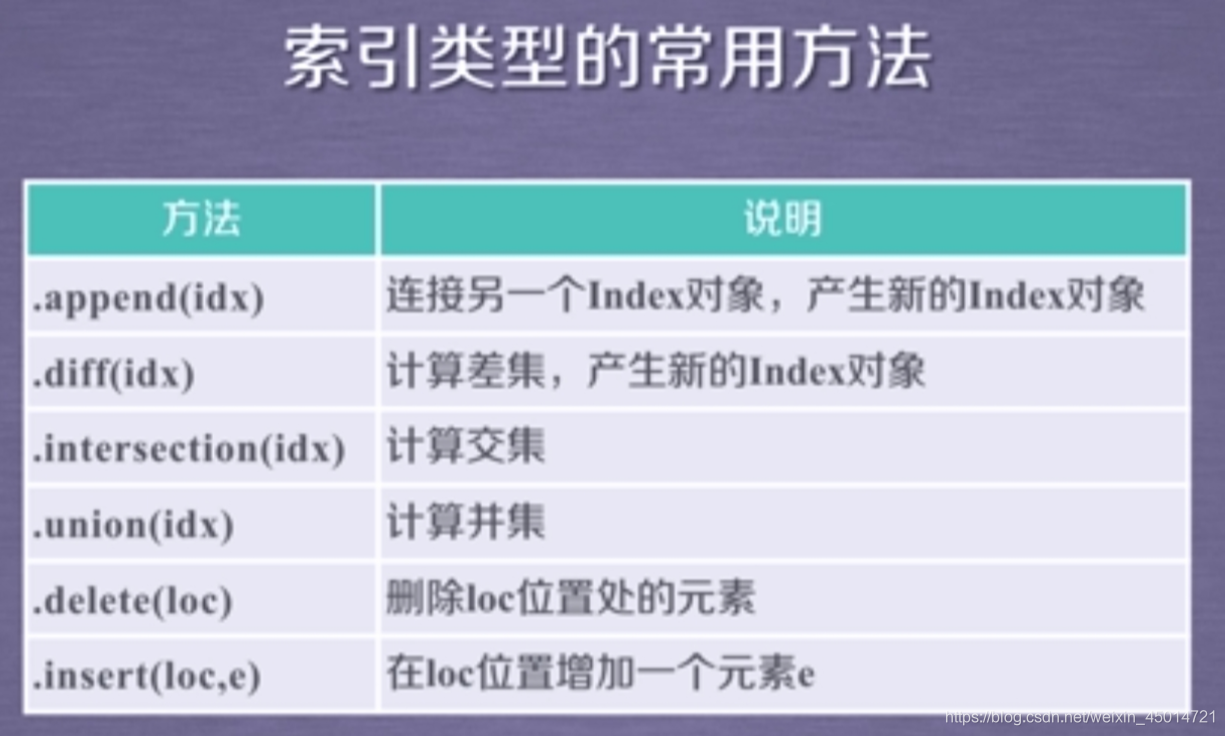
③索引类型
④算术运算
import pandas as pd
import numpy as np
a = pd.DataFrame(np.arange(12).reshape(3,4))
'''
   0  1   2   3
0  0  1   2   3
1  4  5   6   7
2  8  9  10  11
'''
b=pd.DataFrame(np.arange(20).reshape(4,5))
'''
    0   1   2   3   4
0   0   1   2   3   4
1   5   6   7   8   9
2  10  11  12  13  14
3  15  16  17  18  19
'''
a+b
'''
      0     1     2     3   4
0   0.0   2.0   4.0   6.0 NaN
1   9.0  11.0  13.0  15.0 NaN
2  18.0  20.0  22.0  24.0 NaN
3   NaN   NaN   NaN   NaN NaN
'''
a*b
'''
      0     1      2      3   4
0   0.0   1.0    4.0    9.0 NaN
1  20.0  30.0   42.0   56.0 NaN
2  80.0  99.0  120.0  143.0 NaN
3   NaN   NaN    NaN    NaN NaN
'''

import pandas as pd
import numpy as np
a = pd.DataFrame(np.arange(12).reshape(3,4))
'''
   0  1   2   3
0  0  1   2   3
1  4  5   6   7
2  8  9  10  11
'''
b=pd.DataFrame(np.arange(20).reshape(4,5))
'''
    0   1   2   3   4
0   0   1   2   3   4
1   5   6   7   8   9
2  10  11  12  13  14
3  15  16  17  18  19
'''
m=b.add(a,fill_value=100)  # 缺值用100补
'''
       0      1      2      3      4
0    0.0    2.0    4.0    6.0  104.0
1    9.0   11.0   13.0   15.0  109.0
2   18.0   20.0   22.0   24.0  114.0
3  115.0  116.0  117.0  118.0  119.0
'''
mm=a.mul(b,fill_value=0)  #相乘
'''
      0     1      2      3    4
0   0.0   1.0    4.0    9.0  0.0
1  20.0  30.0   42.0   56.0  0.0
2  80.0  99.0  120.0  143.0  0.0
3   0.0   0.0    0.0    0.0  0.0
'''
import pandas as pd
import numpy as np
b= pd.DataFrame(np.arange(20).reshape(4,5))
'''
    0   1   2   3   4
0   0   1   2   3   4
1   5   6   7   8   9
2  10  11  12  13  14
3  15  16  17  18  19
'''
c = pd.Series(np.arange(4))
'''
0    0
1    1
2    2
3    3
dtype: int32
'''
b-c
'''
      0     1     2     3   4
0   0.0   0.0   0.0   0.0 NaN
1   5.0   5.0   5.0   5.0 NaN
2  10.0  10.0  10.0  10.0 NaN
3  15.0  15.0  15.0  15.0 NaN
二维与一维运算时是二维的所有轴1(横行)与一维的数据进行运算
也就是b的每一行都减去一下c
'''
b.sub(c,axis=0)
'''
使用这种运算方法便可以使得轴0参与运算
    0   1   2   3   4
0   0   1   2   3   4
1   4   5   6   7   8
2   8   9  10  11  12
3  12  13  14  15  16
'''
⑤比较运算
import pandas as pd
import numpy as np
a = pd.DataFrame(np.arange(12).reshape(3,4))
'''
   0  1   2   3
0  0  1   2   3
1  4  5   6   7
2  8  9  10  11
'''
d=pd.DataFrame(np.arange(12,0,-1).reshape(3,4))
'''
    0   1   2  3
0  12  11  10  9
1   8   7   6  5
2   4   3   2  1
'''
a>d
'''
       0      1      2      3
0  False  False  False  False
1  False  False  False   True
2   True   True   True   True
'''
a==d
'''
       0      1      2      3
0  False  False  False  False
1  False  False   True  False
2  False  False  False  False
'''
import pandas as pd
import numpy as np
a = pd.DataFrame(np.arange(12).reshape(3,4))
'''
   0  1   2   3
0  0  1   2   3
1  4  5   6   7
2  8  9  10  11
'''
c=pd.Series(np.arange(4))
'''
0    0
1    1
2    2
3    3
dtype: int32
'''
a>c
'''
不同维度,广播运算,默认在1轴
       0      1      2      3
0  False  False  False  False
1   True   True   True   True
2   True   True   True   True
'''
4.pandas数据特征分析(适用于DataFrame和Series)

①对数据的排序
1、sort_index()方法
.sort_index() 方法在指定轴上根据索引进行排序,默认为零轴,升序。.sort_index(axis=0,ascending=True) 为默认
import pandas as pd
import numpy as np
a = pd.DataFrame(np.arange(20).reshape(4,5), index = 'c','a','d','b'])
a
    0    1   2   3   4
c   0    1   2   3   4
a   5    6   7   8   9
d  10   11  12  13  14
b  15   16  17  18  19

# 默认按照0轴索引升序排序
a.sort_index()
    0   1   2   3   4
a   5   6   7   8   9
b  15  16  17  18  19
c   0   1   2   3   4
d  10  11  12  13  14

# 规定按照降序排序
a.sort_index(ascending=False)
    0   1   2   3   4
d  10  11  12  13  14
c   0   1   2   3   4
b  15  16  17  18  19
a   5   6   7   8   9

# 规定在1轴上按照降序排序
a.sort_index(axis=1, ascending=False)
    4   3   2   1   0
c   4   3   2   1   0
a   9   8   7   6   5
d  14  13  12  11  10
b  19  18  17  16  15
2、sort_values()方法
.sort_values() 方法在指定轴上根据数值进行排序,默认为零轴,升序
Series.sort_values(axis=0, ascending=True)
DataFrame.sort_values(by, axis=0, ascending=True)
by: axis 轴上的某个索引或索引列表
b = pd.DataFrame(np.arange(20).reshape(4,5), index = 'a','b','c','d'])
b
    0   1   2   3   4
a   0   1   2   3   4
b   5   6   7   8   9
c  10  11  12  13  14
d  15  16  17  18  19

# 默认在0轴上,指定对索引为2的那一列按照降序排序
b.sort_values(2, ascending=False)
    0   1   2   3   4
d  15  16  17  18  19
c  10  11  12  13  14
b   5   6   7   8   9
a   0   1   2   3   4

# 指定在1轴上,对索引为‘c’的那一行进行降序排序
b.sort_values('c',axis=1, ascending=False)
    4   3   2   1   0
a   4   3   2   1   0
b   9   8   7   6   5
c  14  13  12  11  10
d  19  18  17  16  15
3、对排序时 空值 的处理
NaN 统一放到排序末尾
b = pd.DataFrame(np.arange(20).reshape(4,5), index = 'a','b','c','d'])
a = pd.DataFrame(np.arange(12).reshape(3,4), index = 'a','b','c'])

c = b-a
c
     0    1    2    3   4
a  0.0  0.0  0.0  0.0 NaN
b  1.0  1.0  1.0  1.0 NaN
c  2.0  2.0  2.0  2.0 NaN
d  NaN  NaN  NaN  NaN NaN

c.sort_values(2, ascending = False)
     0    1    2    3   4
c  2.0  2.0  2.0  2.0 NaN
b  1.0  1.0  1.0  1.0 NaN
a  0.0  0.0  0.0  0.0 NaN
d  NaN  NaN  NaN  NaN NaN
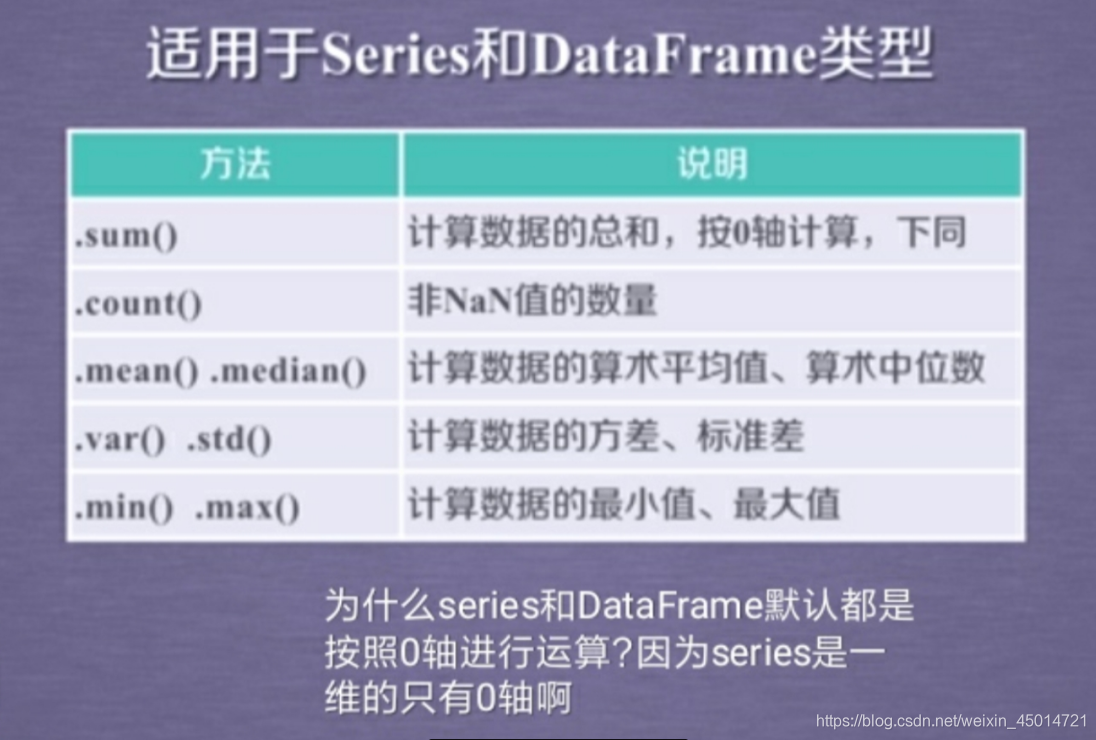
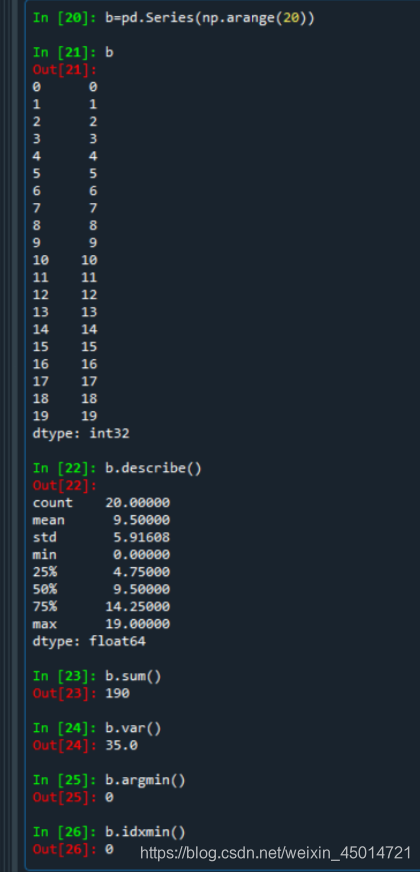
②对数据做统计

a = pd.Series([9,8,7,6], index=['a','b','c','d'])
a
a    9
b    8
c    7
d    6
dtype: int64

# describe()把统计值一次性输出出来
a.describe()
count    4.000000
mean     7.500000
std      1.290994
min      6.000000
25%      6.750000
50%      7.500000
75%      8.250000
max      9.000000
dtype: float64

# describe()输出的为Series类型,可以对其使用Series类型的方法。
type(a.describe())
<class 'pandas.core.series.Series'>

a.describe()['count']
4.0
a.describe()['min']
6.0
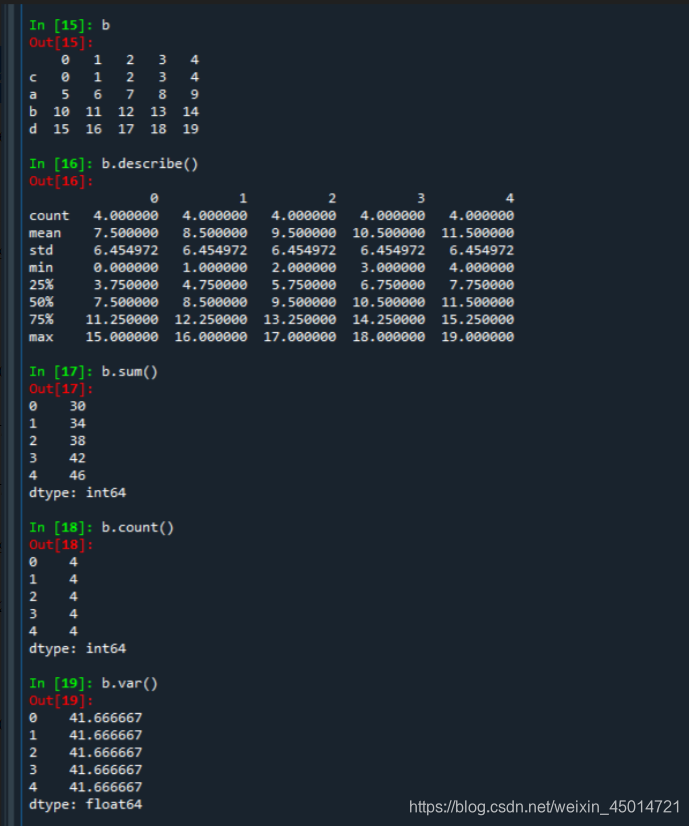
b = pd.DataFrame(np.arange(20).reshape(4,5), index = 'c','a','d','b'])
b.describe()
               0          1          2          3          4
count   4.000000   4.000000   4.000000   4.000000   4.000000
mean    7.500000   8.500000   9.500000  10.500000  11.500000
std     6.454972   6.454972   6.454972   6.454972   6.454972
min     0.000000   1.000000   2.000000   3.000000   4.000000
25%     3.750000   4.750000   5.750000   6.750000   7.750000
50%     7.500000   8.500000   9.500000  10.500000  11.500000
75%    11.250000  12.250000  13.250000  14.250000  15.250000
max    15.000000  16.000000  17.000000  18.000000  19.000000

# describe()输出的为DataFrame类型,可以对其使用DataFrame类型的方法。
type(b.describe())
<class 'pandas.core.frame.DataFrame'>

b.describe()[2]
count     4.000000
mean      9.500000
std       6.454972
min       2.000000
25%       5.750000
50%       9.500000
75%      13.250000
max      17.000000
Name: 2, dtype: float64

# 这里注意一下DataFrame获取某一行数据时的方法
b.describe().ix['max']
0    15.0
1    16.0
2    17.0
3    18.0
4    19.0
Name: max, dtype: float64
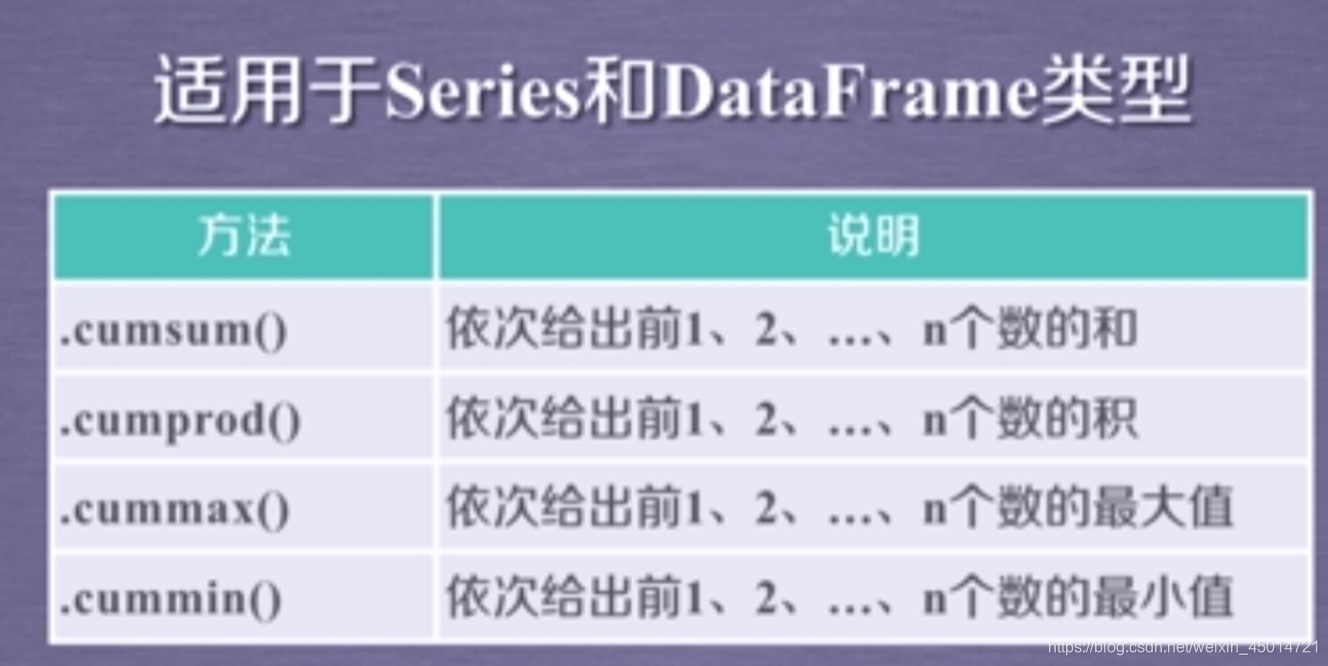
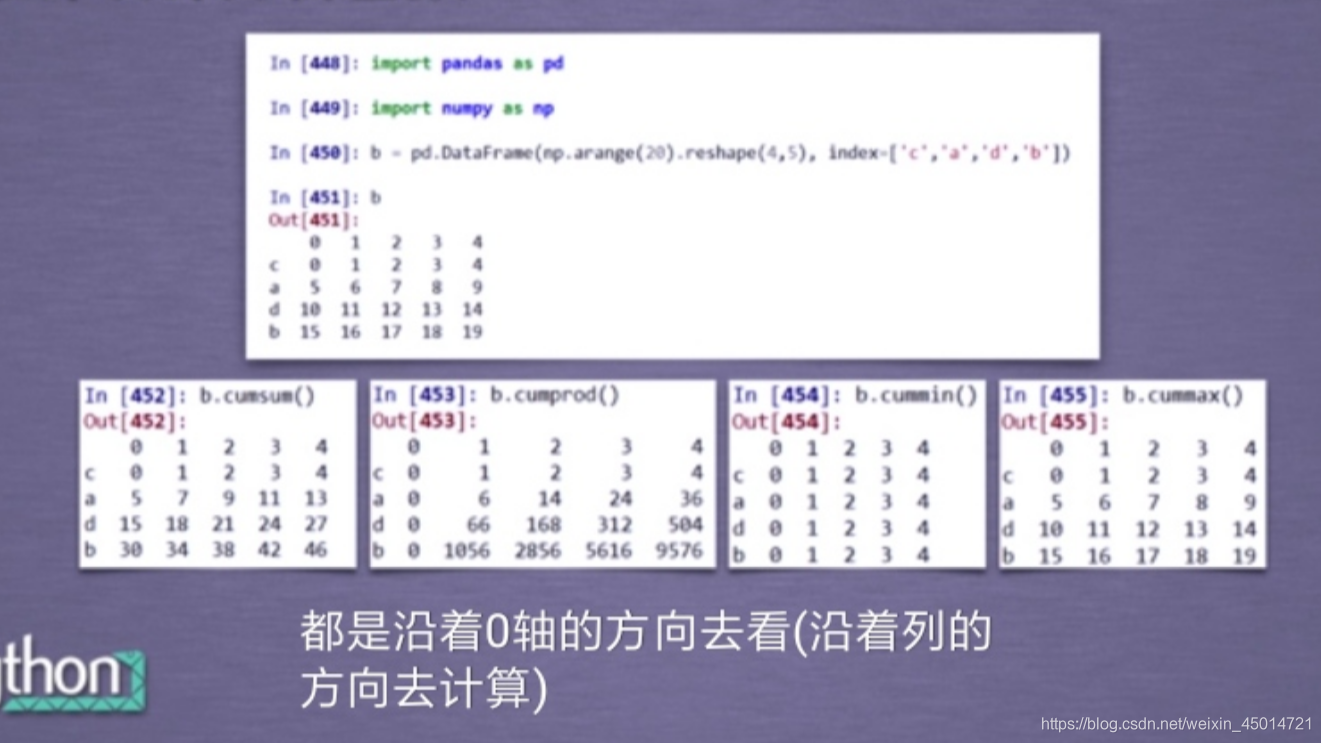
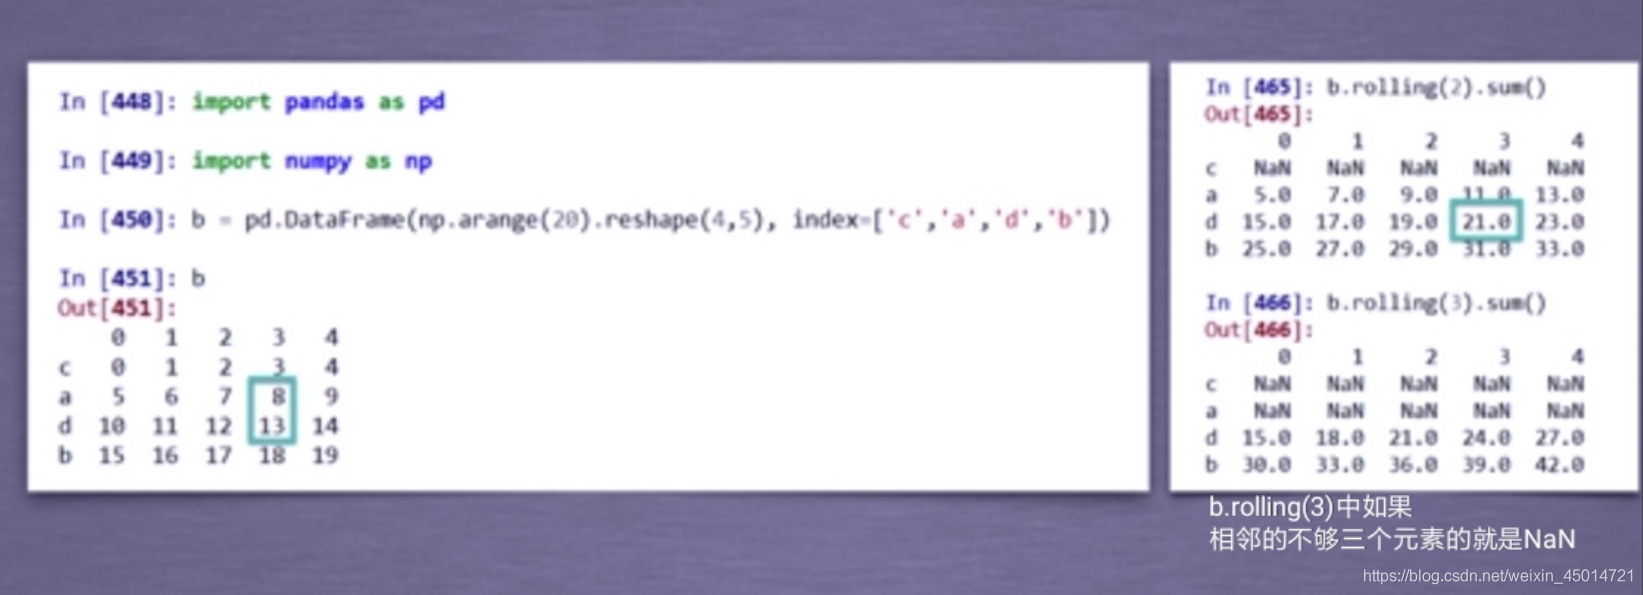
③数据的累计统计分析

5.pandas读取文件
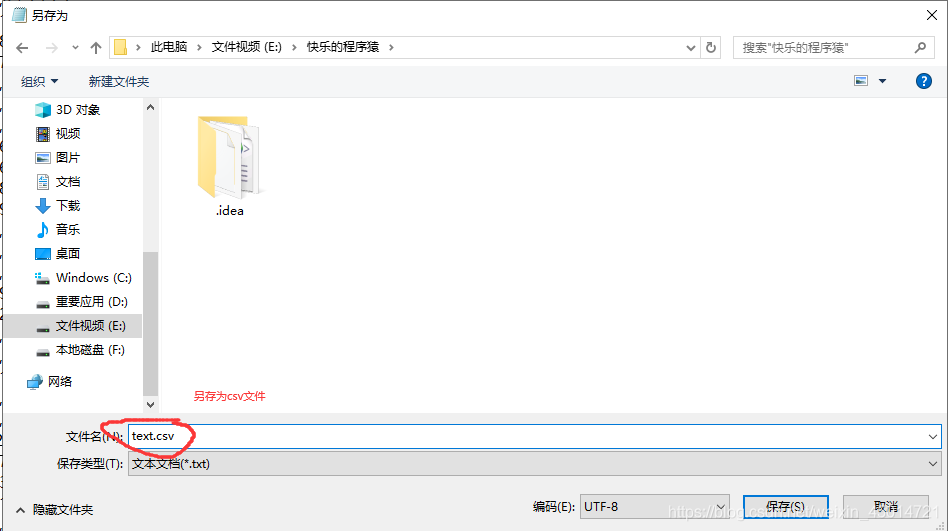
①csv文件
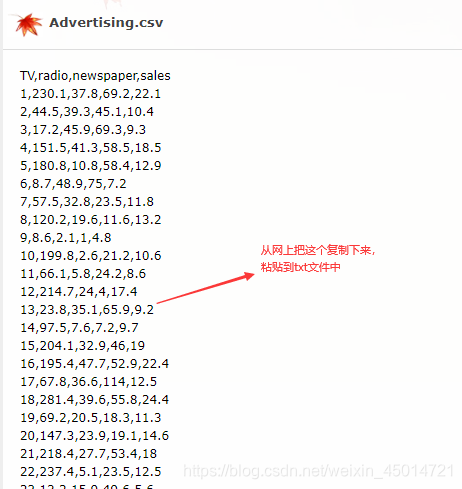
import pandas as pd
# read csv file directly from a URL and save the results
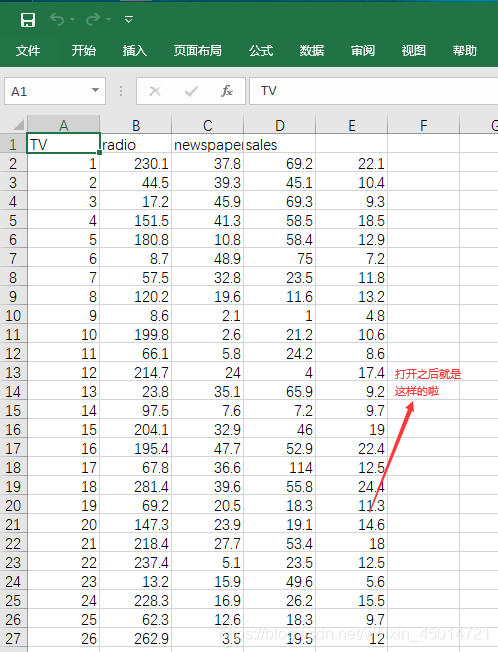
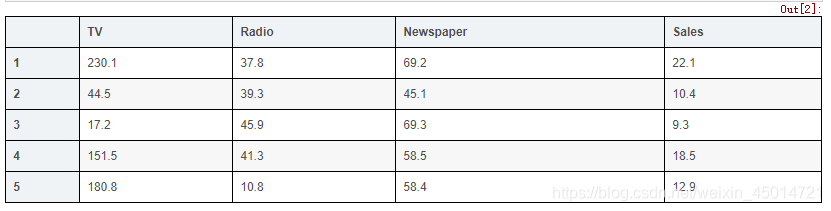
data = pd.read_csv('text.csv', index_col=0)
# display the first 5 rows
data.head()
# display the last 5 rows
data.tail()
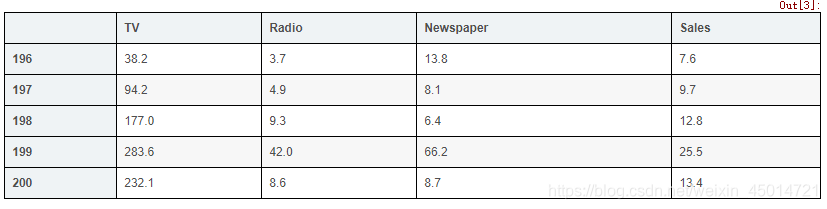
# check the shape of the DataFrame(rows, colums)
data.shape
输出:(200, 4)
#200行数据,四列特征值
②txt文件如下:
这些数据表示的是每个城市的(x,y)坐标。(中间是用空格分开的)

import pandas as pd     #引入pandas包
citys=pd.read_table('./1.txt',sep='\t',header=None)     #读入txt文件,分隔符为\t;若不写head=None,则会把第一行当成列名,读取时会没了第一行数据
print(citys)
打印结果:

可以看到全部数据就只有一列了,因为分割符为制表符,而制表符存在于txt文件每行的末尾。
接着把第一列的名字改成x,并添加一列,名字为y,y这一列的数值全是None:
citys.columns=['x']
citys['y']=None
print(citys)

最后把 x列中的数据,以空格为分割符,分给y一个数:
for i in range(len(citys)):         #遍历每一行
    coordinate = citys['x'][i].split() #分开第i行,x列的数据。split()默认是以空格等符号来分割,返回一个列表
    citys['x'][i]=coordinate[0]        #分割形成的列表第一个数据给x列
    citys['y'][i]=coordinate[1]        #分割形成的列表第二个数据给y列
print(citys)
可以看到,已经给txt的数据打上了x和y的标志了。


 4万+
4万+


 被折叠的 条评论
为什么被折叠?
被折叠的 条评论
为什么被折叠?
 到【灌水乐园】发言


