


一、字典与列表的相互转换
1.字典中自带列表
dit = {'name':'zxf','age':'22','gender':'male','address':'shanghai'}
那么我问你dit.values()是什么样的?
dit.values()肯定不止一个元素,那么它是如何组织起来的呢?那就是列表,所以dit.values()就是列表格式,就是dict_values(['zxf', '22', 'male', 'shanghai'])
list(dit.values())就是['zxf', '22', 'male', 'shanghai']


print("***********************************")
dit = {0:0.15,1:0.33,2:0.24,3:0.66,4:0.66,5:0.5,6:0.5,7:1.0,8:0.5}
print(dit.values())
print(dit.keys())
print(list(dit.values()))
print(list(dit.keys()))
#这四种都一样,是完全等价的,都是[0,1,2,3,4,5,6,7,8]这种列表类型。
既可以np.mean(dit.values()),max(dit.values());也可以np.mean(list(dit.values())),max(list(dit.values()));
既可以[dit[i] for i in list(dit.keys())];也可以[dit[i] for i in dit.keys()]
2.字典和列表的相互转换
print("***********************************")
print("不带括号的字典转列表")
dit = {'name':'zxf','age':'22','gender':'male','address':'shanghai'}
lst = list(dit) #这仅仅是把键转换为列表
print(lst)  # ['name', 'age', 'gender', 'address']
lst2 = list(dit.values())
print(lst2)  # ['zxf', '22', 'male', 'shanghai']
lst3=list(dit.items())
print(lst3)#[('name', 'zxf'), ('age', '22'), ('gender', 'male'), ('address', 'shanghai')]

print("***********************************")
print("带括号的字典转列表")
dit1={(1,2),(3,4),(5,6),(7,8)}#不存在键值对,这其实不属于正规的字典
lst1=list(dit1)
print(lst1)  #[(1, 2), (3, 4), (5, 6), (7, 8)]

dit2=dict(lst1)
print(dit2)  #{1: 2, 3: 4, 5: 6, 7: 8}

print(list(dit2)) #[1, 3, 5, 7]
print(list(dit2.values()))#[2, 4, 6, 8]
print(list(dit2.items())) #[(1, 2), (3, 4), (5, 6), (7, 8)]

print("***********************************")
print("带括号的列表转字典")
lst3=[(1, 2), (3, 4), (5, 6), (7, 8)]
dit3=dict(lst3)
print(dit3) #{1: 2, 3: 4, 5: 6, 7: 8}

print("***********************************")
print("不带括号的列表转字典")
a = ['a1','a2','a3','a4']
b = ['b1','b2','b3']
d = zip(a,b)
print(d)  #输出结果为<zip object at 0x102FAF80>像这种键-值对应的,肯定用字典输出才行
print(dict(d))  #{'a1': 'b1', 'a2': 'b2', 'a3': 'b3'}

print("***********************************")
总之,
列表转字典,这个列表必须是具有“键-值”特性[(1, 2)],否则不能转
字典转列表,你必须考虑好是转字典的键 还是 转列表的值 还是 转列表的键+值

*********************************************************************************

target=['setosa','versicolor','virginica']
color=['blue','red','green']

那么:
dict(zip(target,color))={'setosa': 'blue', 'versicolor': 'red', 'virginica': 'green'}
dict(zip(range(target),color))={0: 'blue', 1: 'red', 2: 'green'}
list(zip(target,color))=[('setosa', 'blue'), ('versicolor', 'red'), ('virginica', 'green')]

*********************************************************************************

target=['setosa','versicolor','virginica']
color=['blue','red','green']

for X,Y in zip(target,color):
    print(X)

'''
setosa
versicolor
virginica
'''

for X,Y in dict(zip(target,color)).items():
    print(X)

'''
setosa
versicolor
virginica
'''
二、列表能干什么?
1.用作[xi for xi in [1,2,3,4,5,6]]
range(N)事实上就是一个列表,
所以有[xi  for xi in range(15)]的这种用法
2…绘图
plt.plot(列表1,列表2)
plt.scatter(列表1,列表2)
这些绘图的处理的数据都是列表
①
range(N)事实上就是一个列表,
所以有plt.plot(range(15),[scipy.stats.poisson.pmf(xi,k) for xi in range(15)],‘ro-’)这种用法
②
最简单的是绘图是plt.plot(列表1,列表2),但是实际应用中非常常见的是plt.plot(range(15),[scipy.stats.poisson.pmf(xi,k) for xi in range(15)],‘ro-’),你也要非常熟悉
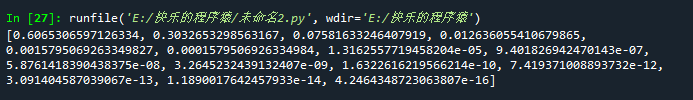
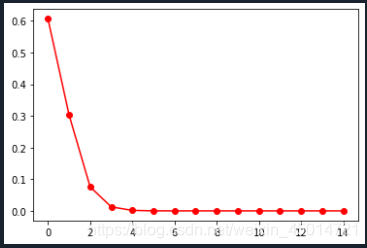
import scipy.stats
import matplotlib.pyplot as plt
k=0.5
print([scipy.stats.poisson.pmf(xi,k) for xi in range(15)])#泊松分布
plt.plot(range(15),[scipy.stats.poisson.pmf(xi,k) for xi in range(15)],'ro-')
③
cluster={0:0.15,1:0.33,2:0.24,3:0.66,4:0.66,5:0.5,6:0.5,7:1.0,8:0.5} #8个节点的集聚系数
degree={0:2,1:1,2:4,3:5,4:2,5:1,6:4,7:2,8:3}  #8个节点的度
plt.scatter([degree[i] for i in list(degree.keys())],[cluster[i] for i in list(cluster.keys())]) #度与集聚系数的关系
import matplotlib.pyplot as plt
cluster={0:0.15,1:0.33,2:0.24,3:0.66,4:0.66,5:0.5,6:0.5,7:1.0,8:0.5} #8个节点的集聚系数
degree={0:2,1:1,2:4,3:5,4:2,5:1,6:4,7:2,8:3}  #8个节点的度
plt.subplot(121)
plt.hist(list(cluster.values()),bins=5)
plt.subplot(122)
plt.scatter([degree[i] for i in list(degree.keys())],[cluster[i] for i in list(cluster.keys())]) #度与集聚系数的关系

3.用作(1 if -1 in [0,2,5,8,7,9,1] else 0)
labels=[0, -1, 0, 1, -1, 1, 0, 1, 2, -1, 1, 0, 1, 1, 3, -1, -1, 3, -1, 1, 1, -1, 1, 3, 4, -1, 1, 1, 2, 0, 2, 2, -1, 0, 1, 0, 0, 0, 1, 3, -1, 0, 1, 1, 0, 0, 2, -1, 1, 3, 1, -1, 3, -1, 3, 0, 1, 1, 2, 3, 3, -1, -1, -1, 0, 1, 2, 1, -1, 3, 1, 1, 2, 3, 0, 1, -1, 2, 0, 0, 3, 2, 0, 1, -1, 1, 3, -1, 4, 2, -1, -1, 0, -1, 3, -1, 0, 2, 1, -1, -1, 2, 1, 1, 2, 0, 2, 1, 1, 3, 3, 0, 1, 2, 0, 1, 0, -1, 1, 1, 3, -1, 2, 1, 3, 1, 1, 1, 2, -1, 5, -1, 1, 3, -1, 0, 1, 0, 0, 1, -1, -1, -1, 2, 2, 0, 1, 1, 3, 0, 0, 0, 1, 4, 4, -1, -1, -1, -1, 4, -1, 4, 4, -1, 4, -1, 1, 2, 2, 3, 0, 1, 0, -1, 1, 0, 0, 1, -1, -1, 0, 2, 1, 0, 2, -1, 1, 1, -1, -1, 0, 1, 1, -1, 3, 1, 1, -1, 1, 1, 0, 0, -1, 0, -1, 0, 0, 2, -1, 1, -1, 1, 0, -1, 2, 1, 3, 1, 1, -1, 1, 0, 0, -1, 0, 0, 3, 2, 0, 0, 5, -1, 3, 2, -1, 5, 4, 4, 4, -1, 5, 5, -1, 4, 0, 4, 4, 4, 5, 4, 4, 5, 5, 0, 5, 4, -1, 4, 5, 5, 5, 1, 5, 5, 0, 5, 4, 4, -1, 4, 4, 5, 4, 0, 5, 4, -1, 0, 5, 5, 5, -1, 4, 5, 5, 5, 5, 4, 4]
print(set(labels)) #set(labels)统计出了这个列表里面的包含的元素集合{0, 1, 2, 3, 4, 5, -1}
n_clusters_ = len(set(labels))  - (1 if -1 in labels else 0)  #减去噪声数据(-1)占的位置
print("Estimate number of clusters:%d"%n_clusters_)#输出蔟的个数
'''Estimate number of clusters:6'''
4.用作np.mean(列表)和np.max(列表)
nx.degree(G)得到的是[(0, 3), (1, 1), (2, 1), (3, 3), (4, 2), (5, 2)]这种列表类型(不适合做平均运算)
degs=dict(nx.degree(G))转换成{0: 3, 1: 1, 2: 1, 3: 3, 4: 2, 5: 2}字典类型
list(degs.values())是[3,1,1,3,2,2]列表类型 就可以用np.mean(list(degs.values()))

5.列表中的列表“列表[列表[]]”
import numpy as np
labels=[0, -1, 0, 1, -1, 1, 0, 1, 2, -1, 1, 0, 1, 1, 3, -1, -1, 3, -1, 1, 1, -1, 1, 3, 4, -1, 1, 1, 2, 0, 2, 2, -1, 0, 1, 0, 0, 0, 1, 3, -1, 0, 1, 1, 0, 0, 2, -1, 1, 3, 1, -1, 3, -1, 3, 0, 1, 1, 2, 3, 3, -1, -1, -1, 0, 1, 2, 1, -1, 3, 1, 1, 2, 3, 0, 1, -1, 2, 0, 0, 3, 2, 0, 1, -1, 1, 3, -1, 4, 2, -1, -1, 0, -1, 3, -1, 0, 2, 1, -1, -1, 2, 1, 1, 2, 0, 2, 1, 1, 3, 3, 0, 1, 2, 0, 1, 0, -1, 1, 1, 3, -1, 2, 1, 3, 1, 1, 1, 2, -1, 5, -1, 1, 3, -1, 0, 1, 0, 0, 1, -1, -1, -1, 2, 2, 0, 1, 1, 3, 0, 0, 0, 1, 4, 4, -1, -1, -1, -1, 4, -1, 4, 4, -1, 4, -1, 1, 2, 2, 3, 0, 1, 0, -1, 1, 0, 0, 1, -1, -1, 0, 2, 1, 0, 2, -1, 1, 1, -1, -1, 0, 1, 1, -1, 3, 1, 1, -1, 1, 1, 0, 0, -1, 0, -1, 0, 0, 2, -1, 1, -1, 1, 0, -1, 2, 1, 3, 1, 1, -1, 1, 0, 0, -1, 0, 0, 3, 2, 0, 0, 5, -1, 3, 2, -1, 5, 4, 4, 4, -1, 5, 5, -1, 4, 0, 4, 4, 4, 5, 4, 4, 5, 5, 0, 5, 4, -1, 4, 5, 5, 5, 1, 5, 5, 0, 5, 4, 4, -1, 4, 4, 5, 4, 0, 5, 4, -1, 0, 5, 5, 5, -1, 4, 5, 5, 5, 5, 4, 4]
labels=np.array(labels)
print(labels)

ratio = len(labels[labels[:]==-1]) / len(labels) # 判定噪声数据(label被打上-1)数据所占的比例
print("Noise ratio:{:.2f}".format(ratio)) #输出噪声数据所占的比例
'''
labels[:]==-1得到的是[False  True False False  True ...]这样的列表
labels[labels[:]==-1]得到的是[-1 -1 -1 -1...]这种所有等于-1的元素集合起来的列表
len(labels[labels[:]==-1])就是求出了在labels里面元素等于-1的个数
'''

总之,在np.array数组里面,有ratio = len(labels[labels[:]==-1]) / len(labels) 这样的用法来统计个数,你必须知道

实例:
import numpy as np
city=['太原','北京','上海','成都','西安','南京','广州','西宁']
rank=[  2,    0,      0,     1,     1,    1,    0,      2  ] #城市对应的排名
ranks=np.array(rank)
citys=np.array(city)

print(ranks[:]==2)  #[False False False  True  True  True False False]
print('----------------------------------------------------')

num=len( ranks[ranks[:]==2] )   #ranks里面元素等于2的元素的数量(也就是排名第二的城市的数量)
print(num)
print('----------------------------------------------------')

print( citys[ranks[:]==2]  )  #输出排名第二的城市
print('----------------------------------------------------')

print( set(ranks) )
print('----------------------------------------------------')

for i in range( len(set(ranks)) ):
    print('排名第',i,'的城市是:')
    print( citys[ranks[:]==i] )
print('----------------------------------------------------')

6.相互依存的列表
- cityName=[‘北京’,‘上海’,…]是一个包含31个省份名字的列表
- label=[2 0 3 3 3 1 …]含有31个数字代表相应省份所在的蔟。
- label是根据省份消费水平划分的蔟,label里面的0代表第0个蔟,一共有0、1、2、3四个蔟
- cityName和label是相互依存的两个列表
现在想要把每个蔟里面的省份输出来
CityCluster=[[],[],[],[]]   #四个蔟
for i in range(len(cityName)):
    CityCluster[label[i]].append(cityName[i])
for i in range(len(CityCluster)):
    print(CityCluster[i])

三、字典能干什么?
你想要娴熟的使用字典和列表那就得清楚的知道字典和列表能干什么
1.字典最重要的功能就是转换成列表,然后按列表的处理方式去处理
一个数据是dit = {0:0.15,1:0.33,2:0.24,3:0.66,4:0.66,5:0.5,6:0.5,7:1.0,8:0.5}
dit.values()和list(dit.values())都是列表
既可以np.mean(dit.values());也可以np.mean(list(dit.values()));
既可以[dit[i] for i in list(dit.keys())];也可以[dit[i] for i in dit.keys()]
cluster={0:0.15,1:0.33,2:0.24,3:0.66,4:0.66,5:0.5,6:0.5,7:1.0,8:0.5} #8个节点的集聚系数
degree={0:2,1:1,2:4,3:5,4:2,5:1,6:4,7:2,8:3}  #8个节点的度
plt.scatter([degree[i] for i in list(degree.keys())],[cluster[i] for i in list(cluster.keys())]) #度与集聚系数的关系


 2501
2501


 被折叠的 条评论
为什么被折叠?
被折叠的 条评论
为什么被折叠?
 到【灌水乐园】发言


