


1.es的背景
(1)Elasticsearch基于Java语言开发,所以在安装Elasticsearch之前必须先安装JDK,Elasticsearch7要求安装JDK1.8以上版本;
(2)kibnan在ELK家族中主要起到数据可视化的作用,通过表,图,统计等不同的方式将数据以更加直观的方式显示,同时kibana必须运行于Elasticsearch的基础上,即kibana就是Elasticsearch的可视化GUI;
(3)Filebeat是beat组件的一种类型,filebeat一般安装在宿主机,用于收集文本类型的日志文件,然后把日志文件内容存储在es中
2.版本说明:
7.7.0(三个组件必须使用同一个版本)
3.软件下载源:
(1)Elaticsearch下载url:
https://artifacts.elastic.co/downloads/elasticsearch/elasticsearch-7.7.0-linux-x86_64.tar.gz
(2)kibana下载url:
https://artifacts.elastic.co/downloads/kibana/kibana-7.7.0-linux-x86_64.tar.gz
(3)filebeat下载url:
https://artifacts.elastic.co/downloads/beats/filebeat/filebeat-7.7.0-linux-x86_64.tar.gz
4.安装:
安装方法简单,解压即可用
5.Elasticsearch的配置文件说明
(1)配置文件名称:elasticsearch.yml
(2)配置文件字段说明:
(3)cluster.name:Elasticsearch集群的名称,用于服务的发现,其他节点加入集群是要通过集群的名称加入相应的集群
(4)node.name:当前机器在集群中的节点名称
(5)node.master: true是否成为master节点node.data:指定该节点是否存储索引数据,为true时允许
(6)network.host: 指定能访问该服务的IP地址,默认是环回地址,配置为0.0.0.0允许所有网络的访问
(7)http.port: 服务的打开的端口,默认是9200
(8)node ingest:是否开启节点处理,默认打开,关闭可配置为false
6.kibana的配置文件说明
(1)elasticsearch.hosts: 指定elasticsearch所在的机器的ip
(2)server.port: 指定服务的端口,默认是5601
(3)server.host: 指定能访问服务的IP来源,0.0.0.0允许所有
7.filebeat配置文件说明
(1)配置文件名称:filebeat.yml
(2)- type: log #指定类型为log
enabled: true
(3)paths:
-
/app/applogs/info.log #指定监控要监控的日志文件的路径
(4)setup.kibana:
host: “10.206.196.84:5601” #指定kibana所在主机的ip和服务监听的端口
(5)output.elasticsearch:
hosts: [“10.206.196.84:9200”] #指定es所在主机的ip以及服务监听的端口
(6)output.elasticsearch:
index:配置自定义索引
(7)multiline.pattern,multiline.negate,multiline.match与开启日志多行合并相关
8.启动:
(1)es不能使用root启动
(2)elasticsearch启动:直接执行安装目录下bin目录下的启动脚本elasticsearch
(3)kibana启动:直接执行安装目录下bin目录下的启动脚本kibana
(4)filebeat启动:执行安装目录下bin目录下的启动脚本filebeat并使用-c参数指定filebeat的配置文件filebeat.yml
(5)查看es的健康状态:
curl http://ip:port/_cat/health
(6)查看es上的所有索引:
curl http:/ip:port/_cat/indices
(7)es启动常见错:max virtual memory areas vm.max_map_count [65530] is too low, increase to at least [262144]
解决方法:使用root用户需改内核参数,在/etc/sysctl.conf中添加vm.max_map_count=262144,保存后执行sysctl -p使配置立即生效
9.ingest node
(1)ingest node概念:
Ingest Node(预处理节点)是 ES 用于功能上命名的一种节点类型, 可以使用ingest node(预处理节点)在文档被索引执行发生之前对文档进行预处理(pre-process),这些预处理行为发生在预处理节点对批量(bulk)请求和索引(index)请求的拦截的时候,对请进行数据进行转换,然后将转换后的请求数据再传递返回给对应的批量(bulk)请求和索引(index)请求,默认情款下所有节点开启ingest node预处理,如果想禁用可以在elasticsearch的配置文件中配置
node.ingest: false
(2)pipeline的简单定义
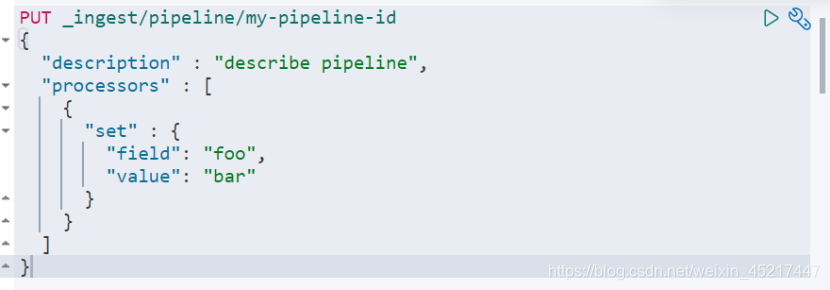
上面的例子,Simulate Pipeline API(pipeline debuger)
为了让开发者更好的了解和使用预处理的方式和原理,官方也提供了相关的接口,来让我们对这些预处理操作进行测试,这些接口,官方称之为: Simulate Pipeline API
简单使用例子如下:
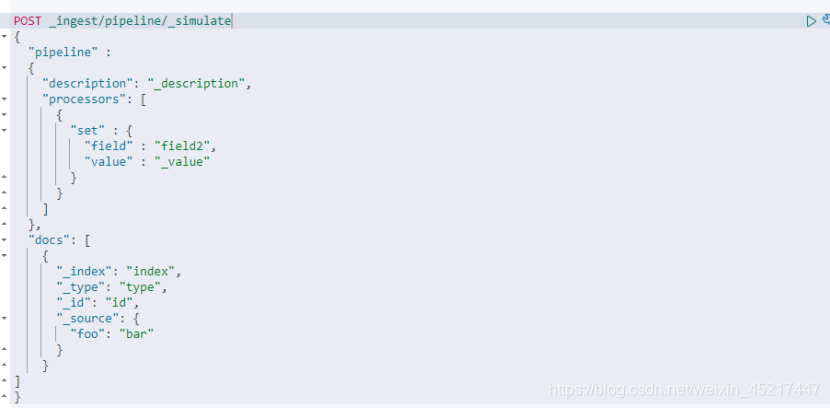
使用simulate pipeline api时使用的方法为POST,pipeline的id固定为_simulate,pipeline字段下的内容为自定义定义的pipeline,这里使用了set处理器,docs字段下的_source字段指定预处理的文档内容包括字段和值,例子中数据字段foo的值为bar,该例子使用由于foo字段原来不存在,所以set处理器给文档内容添加字段foo,并设置foo的值为bar
执行结果如下:

(4)pipeline中常用processors类型的说明与举例(以simulate pipeline api测试)
<1>set处理器
作用:指定字段存在时修改指定字段的值,指定字段不存在时添加指定的字段和值
举例:
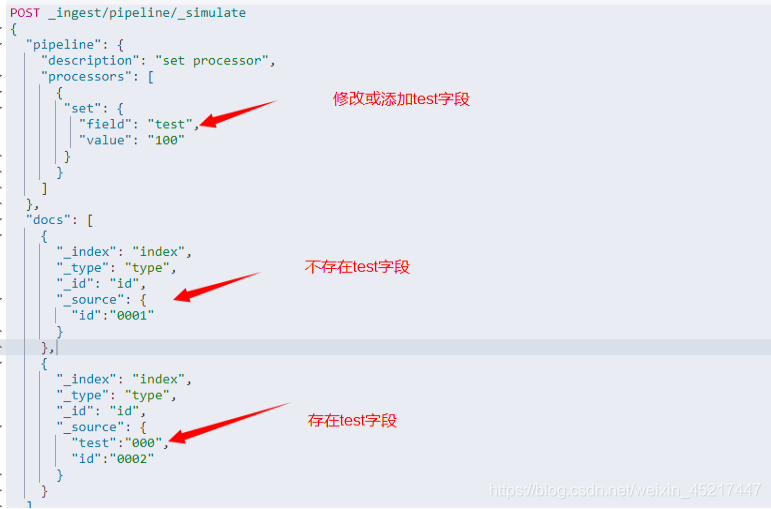
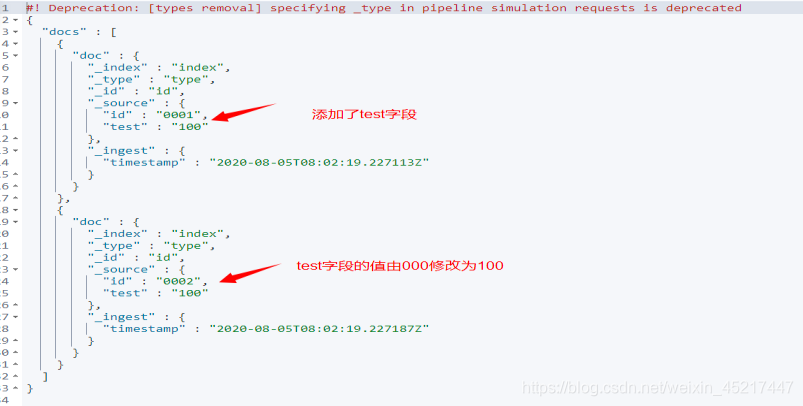
执行结果如下:
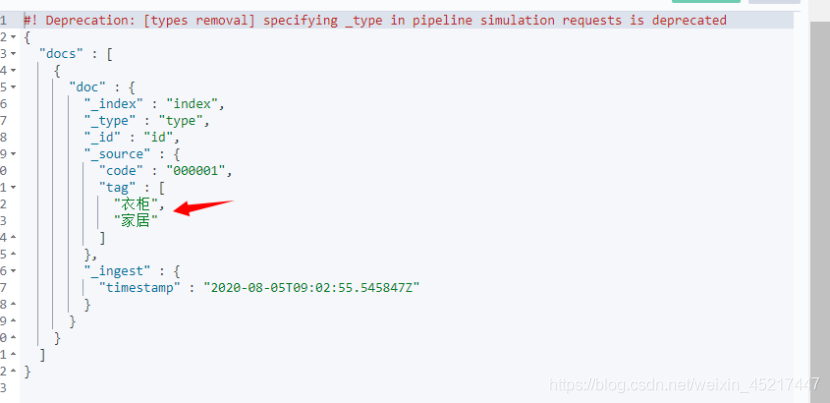
<2>append处理器
追加处理器。就是当我们加载原始文档到 Elasticsearch 的时候,某些字段的描述信息可能需要我们定制性的增加一些额外说明
例子如下:
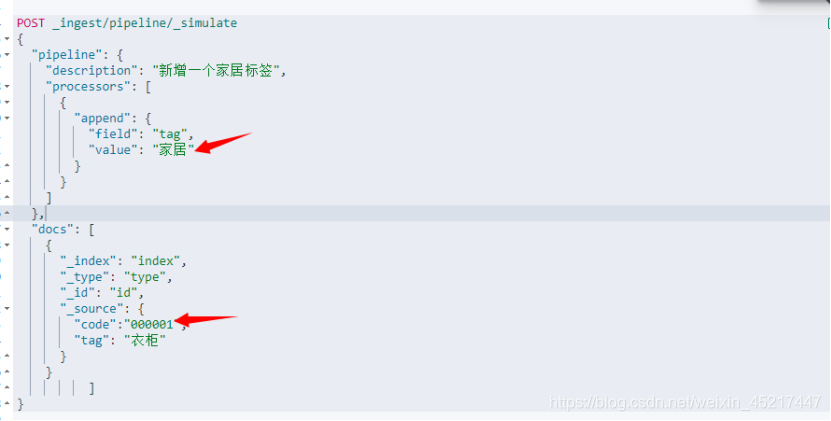
执行结果:
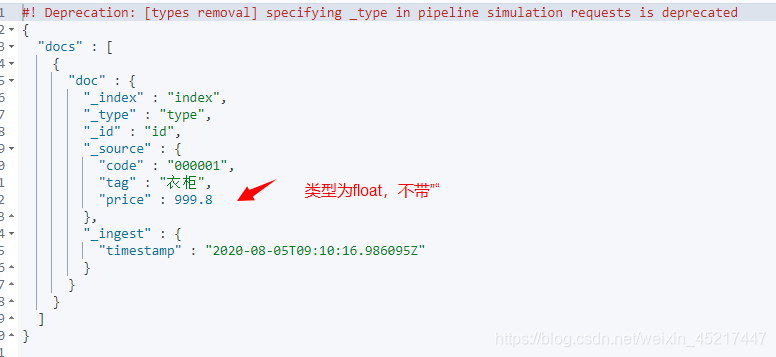
<3> Convert处理器
用于在写入某些文档之前对该文档的字段类型进行转换,比如文档中有个字符串类型的"价格"字段,我们希望将其转换成 float 类型,则我们可以使用该处理器来完成这项操作,目前官方支持转换的类型有如下几个:integer, float, string, boolean, and auto,auto是根据类型最相似完成转换
例子如下:
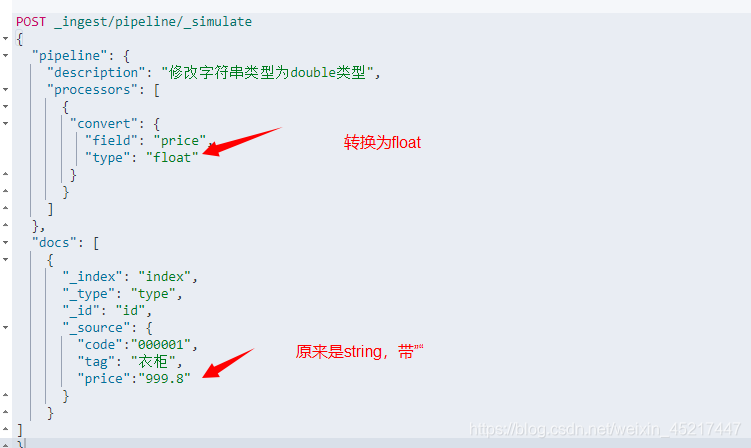
执行结果:
<4>date处理器
是将原文档中的某个日期字段转换成一个 Elasticsearch 识别的时间戳字段(一般默认为@timestamp),该时间戳字段将会新增到原文档中,也可以使用 target_field 字段来指定该字段名称,使用timezone指定原来的时间的时区,默认为世界协调时间,转换后默认是北京时间,所以要指定原来的时区,避免出现时差
例子如下:

执行结果:

<5>grok处理器
主要用于切割日志字段生成新字段,完成日志字段的提取解析
使用例程:
日志文件(路径为/app/applogs/info.log)格式如下:
[INFO] 2020-07-23 18:29:43 [/app/totoro/tcl/api/app/subnet/handle.py:fetch_sf_subnet:62]
需求:提取日志文件的日志等级和日志产生的时间戳以及该日子来自那个app(该日志来自的app是tcl

执行结果:

Grok处理器使用patterns匹配文档内容并记录在指定的字段,更多关于grok的使用可以参考文档 《grok匹配案例》
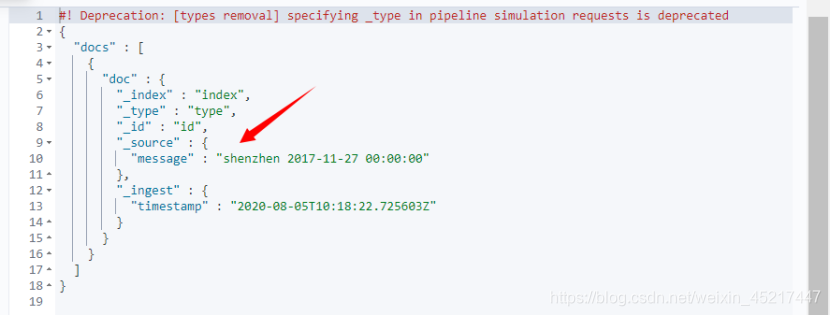
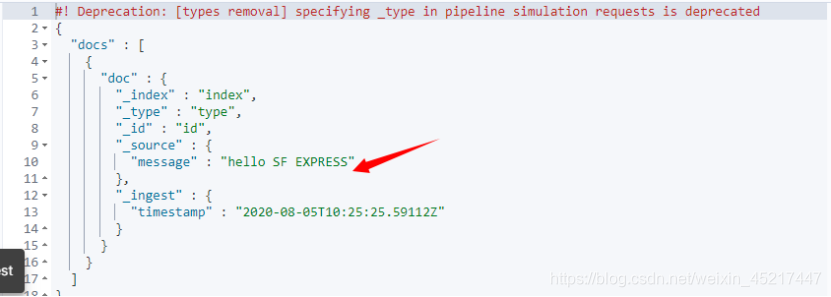
<6>gsub处理器
Gsub Processor 能够解决一些字符串中才特有的问题,按照正则表达式匹配字符串的内容并完成替换,例子如下,使用匹配SF express,使用shenzhen替换

执行结果:
<7>join处理器
能够将原本一个数组类型的字段值,分解成以指定分隔符分割的一个字符串
例子如下:

执行结果:
<8>remove处理器
Remove Processor 是用来处理在写入文档之前,删除原文档中的某些字段值的,只要在处理器下指定filed即可删除对应的字段内容
<9>rename处理器
改变字段的名称,在处理器下使用filed指定要修改的字段名称,使用target_filed指定新的字段名称
<10>lowercase处理器
把字符转转换为小写
<11>uppercase处理器
把字符串转换为大写
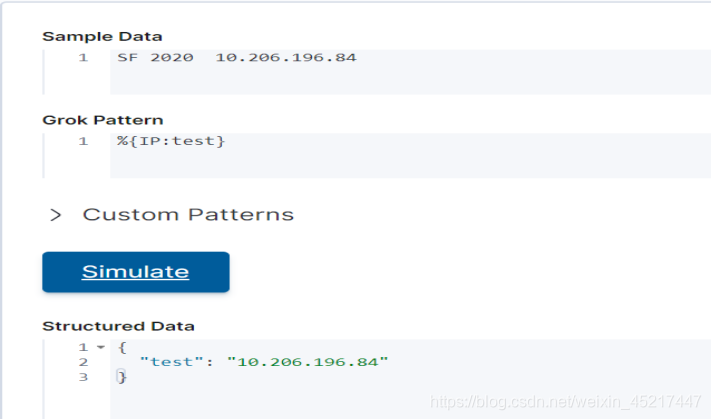
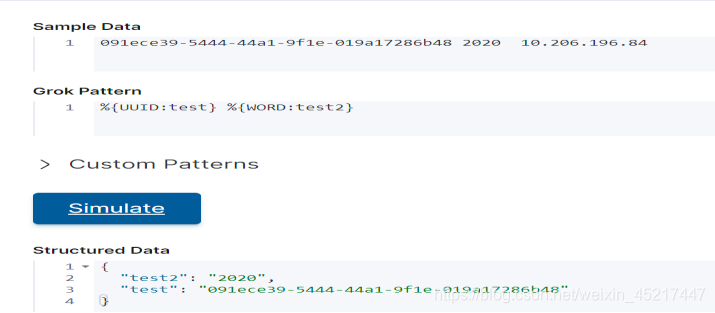
(5)grok处理器pattern语法
<1>grok的语法
%{SYNTAX:SEMANTIC}
SYNTAX:代表匹配值的类型
SEMANTIC:给匹配到的字段的标志
<2>NUMBER:匹配数字

<3>IP:匹配ip地址
<4>WORD:匹配一个单词,一个单词与字母下划线数字组成,不能带有空格,所以WORD也能匹配到一个数字
<5>LOGLEVEL:匹配日志等级(FATAL 、 ERROR 、 WARN 、 INFO 、 DEBUG 、 TRACE 、ERROR、CRITICAL),业务上定义的部分非官方默认日志级别如:SQL,ACCESS等不能匹配到,应使用别的模式匹配
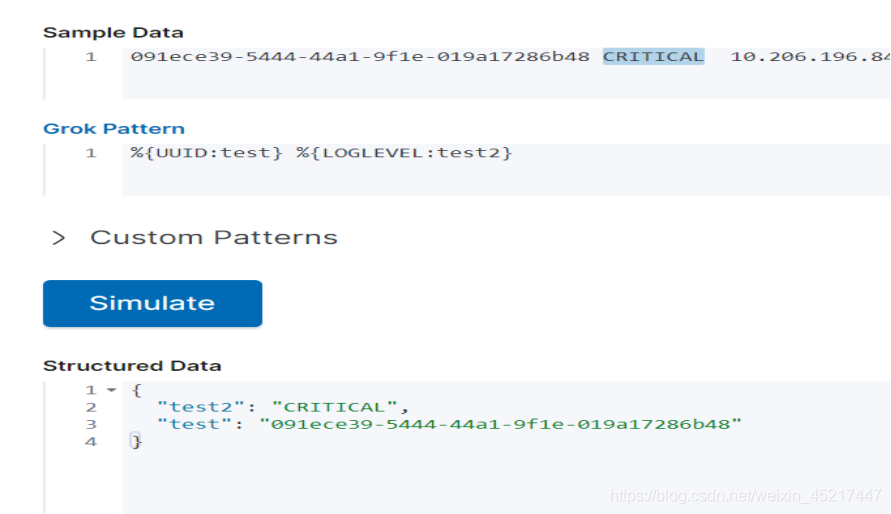
<6> UUID:匹配uuid

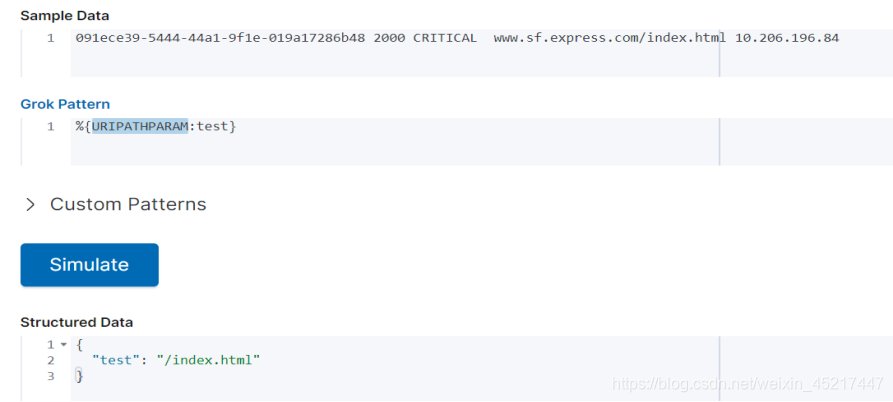
<7>URIPATHPARAM:匹配网站资源url
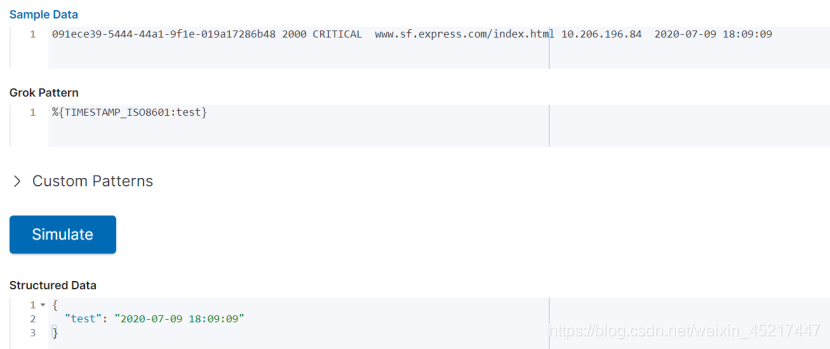
<8>TIMESTAMP_ISO8601:匹配时间,2020-07-09 18:09:00这种格式才能匹配到,日期在前,时间在后,日期时间与一个空格
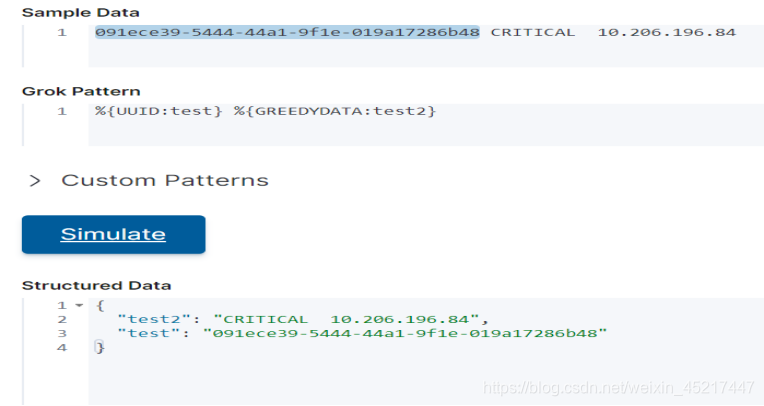
<9>GREEDYDATA:匹配余下没匹配的内容
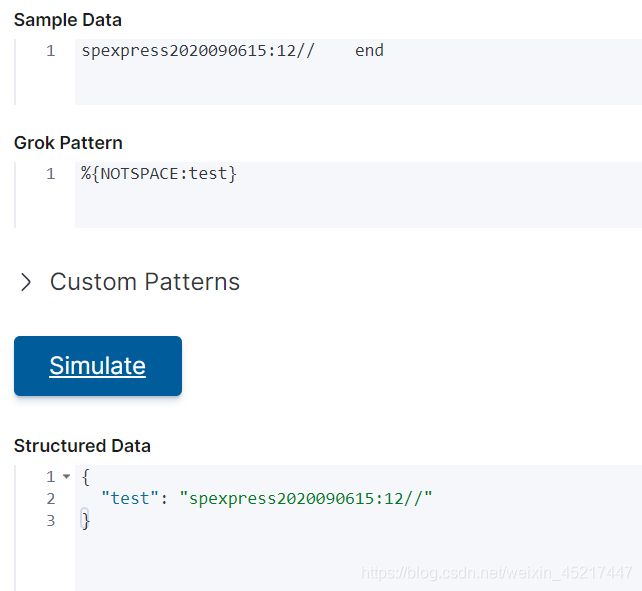
<10>NOTSPACE:连续匹配没有空格的内容
<11>自定义匹配模式:参考正则表达式
例子:匹配[]中的内容

<12>匹配说明:匹配是从左到右,一个匹配模式只能匹配一次,两个匹配模式之间存在间隔要与数据字段间隔一致,一般正则表达式在此也可以正常使用,比如.与*等都可以使用
10.使用ingest node解析日志字段案例
(1)例背景:解析机器上路径为/app/applogs/tcl/log/.log所有日志中的时间戳,日志等级以及日志来源app(app字段的解析来自日子路径)
(2)日志格式:[ INFO] 2020-09-09 18:29:43 /app/totoro/tcl/api/app/subnet/handle.py:fetch_sf_subnet:56] - request url:http://10.203.178.126/net/v1/get_sf_subnet/, headers
(3)elasticsearch配置文件内容
# ======================== Elasticsearch Configuration =========================
#
# NOTE: Elasticsearch comes with reasonable defaults for most settings.
#       Before you set out to tweak and tune the configuration, make sure you
#       understand what are you trying to accomplish and the consequences.
#
# The primary way of configuring a node is via this file. This template lists
# the most important settings you may want to configure for a production cluster.
#
# Please consult the documentation for further information on configuration options:
# https://www.elastic.co/guide/en/elasticsearch/reference/index.html
#
# ----------------------------------Cluster -----------------------------------
#
# Use a descriptive name for your cluster:
#
cluster.name: my-application
#
# ---------------------------------- Node ------------------------------------
#
# Use a descriptive name for the node:
#
node.name: node-1
#
# Add custom attributes to the node:
#
#node.attr.rack: r1
#

# --------------------------------- Paths ------------------------------------
#
# Path to directory where to store the data (separate multiple locations by comma):
#
#path.data: /path/to/data
#
# Path to log files:
#
path.logs: /app/applogs/tcl/
#
# ---------------------------------- Memory -----------------------------------
#
# Lock the memory on startup:
#
#bootstrap.memory_lock: true
#
# Make sure that the heap size is set to about half the memory available
# on the system and that the owner of the process is allowed to use this
# limit.
#
# Elasticsearch performs poorly when the system is swapping the memory.
#

# ------------------------------- Network -----------------------------------
#
# Set the bind address to a specific IP (IPv4 or IPv6):
#
network.host: 0.0.0.0
#
# Set a custom port for HTTP:
#
http.port: 9200
#
# For more information, consult the network module documentation.
#
# -------------------------------- Discovery ----------------------------------
#
# Pass an initial list of hosts to perform discovery when this node is started:
# The default list of hosts is ["127.0.0.1", "[::1]"]
#
discovery.seed_hosts: ["10.206.196.84"]
#
# Bootstrap the cluster using an initial set of master-eligible nodes:
#
cluster.initial_master_nodes: ["node-1"]
#
# For more information, consult the discovery and cluster formation module documentation.
#
# -------------------------------- Gateway -----------------------------------
#
# Block initial recovery after a full cluster restart until N nodes are started:
#
#gateway.recover_after_nodes: 3
#
# For more information, consult the gateway module documentation.
#
# -------------------------------- Various -----------------------------------
#
# Require explicit names when deleting indices:
#
#action.destructive_requires_name: true
bootstrap.memory_lock: false
bootstrap.system_call_filter: false
xpack.security.audit.enabled: true
xpack.license.self_generated.type: basic
xpack.security.transport.ssl.enabled: true
node.ingest: true
(4)kibana配置文件
i18n.locale: "zh_CN"
server.host: "0.0.0.0"
elasticsearch.hosts: "http://127.0.0.1:9200"
(5)filebeat配置文件
###################### Filebeat Configuration Example #########################

# This file is an example configuration file highlighting only the most common
# options. The filebeat.reference.yml file from the same directory contains all the
# supported options with more comments. You can use it as a reference.
#
# You can find the full configuration reference here:
# https://www.elastic.co/guide/en/beats/filebeat/index.html
# For more available modules and options, please see the filebeat.reference.yml sample
# configuration file.
#=========================== Filebeat inputs =============================
filebeat.inputs:
# Each - is an input. Most options can be set at the input level, so
# you can use different inputs for various configurations.
# Below are the input specific configurations.
- type: log
  # Change to true to enable this input configuration.
  enabled: true
  # Paths that should be crawled and fetched. Glob based paths.
  paths:
    - /app/applogs/tcl/*log/*.log
    #- c:\programdata\elasticsearch\logs\*
  # Exclude lines. A list of regular expressions to match. It drops the lines that are
  # matching any regular expression from the list.
  #exclude_lines: ['^DBG']
  # Include lines. A list of regular expressions to match. It exports the lines that are
  # matching any regular expression from the list.
  #include_lines: ['^ERR', '^WARN']
  # Exclude files. A list of regular expressions to match. Filebeat drops the files that
  # are matching any regular expression from the list. By default, no files are dropped.
  #exclude_files: ['.gz$']
  # Optional additional fields. These fields can be freely picked
  # to add additional information to the crawled log files for filtering
  #fields:
  #  level: debug
  #  review: 1
  ### Multiline options
  # Multiline can be used for log messages spanning multiple lines. This is common
  # for Java Stack Traces or C-Line Continuation
 # The regexp Pattern that has to be matched. The example pattern matches all lines starting with [
  multiline.pattern: '^\['
  # Defines if the pattern set under pattern should be negated or not. Default is false.
  multiline.negate: true
  # Match can be set to "after" or "before". It is used to define if lines should be append to a pattern
  # that was (not) matched before or after or as long as a pattern is not matched based on negate.
  # Note: After is the equivalent to previous and before is the equivalent to to next in Logstash
  multiline.match: after
  multiline.max_lines: 10000
#============================= Filebeat modules ===============================
filebeat.config.modules:
  # Glob pattern for configuration loading
  path: ${path.config}/modules.d/*.yml
 # Set to true to enable config reloading
  reload.enabled: false
  # Period on which files under path should be checked for changes
  #reload.period: 10s
#==================== Elasticsearch template setting ==========================
setup.template.settings:
  index.number_of_shards: 1
  #index.codec: best_compression
  #_source.enabled: false
#================================ General =====================================
# The name of the shipper that publishes the network data. It can be used to group
# all the transactions sent by a single shipper in the web interface.
#name:
# The tags of the shipper are included in their own field with each
# transaction published.
#tags: ["service-X", "web-tier"]
# Optional fields that you can specify to add additional information to the
# output.
#fields:
#  env: staging
#============================ Dashboards =====================================
# These settings control loading the sample dashboards to the Kibana index. Loading
# the dashboards is disabled by default and can be enabled either by setting the
# options here or by using the `setup` command.
#setup.dashboards.enabled: false
# The URL from where to download the dashboards archive. By default this URL
# has a value which is computed based on the Beat name and version. For released
# versions, this URL points to the dashboard archive on the artifacts.elastic.co
# website.
#setup.dashboards.url:
#===================== Kibana =================================
# Starting with Beats version 6.0.0, the dashboards are loaded via the Kibana API.
# This requires a Kibana endpoint configuration.
setup.kibana:
  # Kibana Host
  # Scheme and port can be left out and will be set to the default (http and 5601)
  # In case you specify and additional path, the scheme is required: http://localhost:5601/path
  # IPv6 addresses should always be defined as: https://[2001:db8::1]:5601
  host: "10.206.196.84:5601"
  # Kibana Space ID
  # ID of the Kibana Space into which the dashboards should be loaded. By default,
  # the Default Space will be used.
  # st: "10.206.196.84:5601"
  #
  #
  #space.id:
#============================= Elastic Cloud ==================================
# These settings simplify using Filebeat with the Elastic Cloud (https://cloud.elastic.co/).
# The cloud.id setting overwrites the `output.elasticsearch.hosts` and
# `setup.kibana.host` options.
# You can find the `cloud.id` in the Elastic Cloud web UI.
#cloud.id:
# The cloud.auth setting overwrites the `output.elasticsearch.username` and
# `output.elasticsearch.password` settings. The format is `<user>:<pass>`.
#cloud.auth:
#================================ Outputs =====================================
# Configure what output to use when sending the data collected by the beat.
#-------------------------- Elasticsearch output ------------------------------
output.elasticsearch:
  # Array of hosts to connect to.
  hosts: ["10.206.196.84:9200"]
#  index: "myindex"
  pipeline: "pipeline-test"
  index: "my_index"
setup.template.enabled: false
setup.template.name: "myindex"
setup.template.pattern: "myindex*"
setup.ilm.enabled: false
  # Protocol - either `http` (default) or `https`.
  #protocol: "https"
  # Authentication credentials - either API key or username/password.
  #api_key: "id:api_key"
  #username: "elastic"
  #password: "changeme"
#----------------------------- Logstash output --------------------------------
#output.logstash:
  # The Logstash hosts
  #hosts: ["localhost:5044"]
  # Optional SSL. By default is off.
  # List of root certificates for HTTPS server verifications
  #ssl.certificate_authorities: ["/etc/pki/root/ca.pem"]
  # Certificate for SSL client authentication
  #ssl.certificate: "/etc/pki/client/cert.pem"
  # Client Certificate Key
  #ssl.key: "/etc/pki/client/cert.key"
#============================ Processors =====================================
# Configure processors to enhance or manipulate events generated by the beat.
processors:
  - add_host_metadata: ~
  - add_cloud_metadata: ~
  - add_docker_metadata: ~
  - add_kubernetes_metadata: ~
#================================ Logging =====================================
# Sets log level. The default log level is info.
# Available log levels are: error, warning, info, debug
#logging.level: debug
# At debug level, you can selectively enable logging only for some components.
# To enable all selectors use ["*"]. Examples of other selectors are "beat",
# "publish", "service".
#logging.selectors: ["*"]
#=========================== X-Pack Monitoring ===============================
# filebeat can export internal metrics to a central Elasticsearch monitoring
# cluster.  This requires xpack monitoring to be enabled in Elasticsearch.  The
# reporting is disabled by default.
# Set to true to enable the monitoring reporter.
#monitoring.enabled: false
# Sets the UUID of the Elasticsearch cluster under which monitoring data for this
# Filebeat instance will appear in the Stack Monitoring UI. If output.elasticsearch
# is enabled, the UUID is derived from the Elasticsearch cluster referenced by output.elasticsearch.
#monitoring.cluster_uuid:
# Uncomment to send the metrics to Elasticsearch. Most settings from the
# Elasticsearch output are accepted here as well.
# Note that the settings should point to your Elasticsearch *monitoring* cluster.
# Any setting that is not set is automatically inherited from the Elasticsearch
# output configuration, so if you have the Elasticsearch output configured such
# that it is pointing to your Elasticsearch monitoring cluster, you can simply
# uncomment the following line.
#monitoring.elasticsearch:
#================================= Migration ==================================
# This allows to enable 6.7 migration aliases
#migration.6_to_7.enabled: true
(5)使用的pipeline
PUT _ingest/pipeline/pipeline-test
{
"description" : "pipeline-test",
"processors": [
 {
"grok": {
"field": "message",
"patterns": ["%{WORD:log_level}] %{TIMESTAMP_ISO8601:time}"],
"pattern_definitions": {
                        "str": "[\\s\\S]*"
                        }
        }
},
 {
"date": {
"field": "time",
"target_field": "log_time",
"formats": ["yyyy-MM-dd HH:mm:ss"],
 "timezone" : "Asia/Shanghai",
"ignore_failure": true
        }
  },
  {
    "grok": {
    "field": "log.file.path",
    "patterns": ["/app/applogs/%{NOTSPACE:app}/.*/.*"]
            }

  }
]
}
(6)操作过程:启动es后启动kibana,使用浏览器访问es,在kibnaa界面中的dev tools下的console执行前面提到的pipelien后启动filebeat,采集完日志后即可开kibana界面显示提取后的日志内容


 2693
2693


 被折叠的 条评论
为什么被折叠?
被折叠的 条评论
为什么被折叠?
 到【灌水乐园】发言


