


 文章介绍了如何在Vue3和TypeScript项目中使用高德地图2.0的点聚合功能,展示了如何解决点击marker时显示对应信息窗体的问题。通过自定义聚合点和非聚合点的样式,并将数据存储在`extData`中,实现了点击maker时弹出包含详细信息的窗体。
1.vue3+ts 使用高德地图2.0 点聚合 单击maker 显示信息窗体 解决无法 maker 和 需要的信息 相对应问题
2.直接上代码 效果图在下方
AMapLoader.load({
key: "", // 申请好的Web端开发者Key,首次调用 load 时必填
version: "2.0", // 指定要加载的 JSAPI 的版本,缺省时默认为 1.4.15
plugins: [
"AMap.ToolBar",
"AMap.Scale",
"AMap.MapType",
'AMap.PlaceSearch',
'AMap.AutoComplete',
'AMap.MouseTool',
'AMap.Circle',
'AMap.MarkerCluster'
],
})
.then((AMap) => {
map = new AMap.Map("map_box", {
//设置地图容器id
viewMode: "3D", //是否为3D地图模式
zoom: 6, //初始化地图级别
center: locationArr.value, //初始化地图中心点位置
// mapStyle: "amap://styles/270733bbb12c36d9bd368103b6a9e244"
mapStyle: "amap://styles/darkblue"
});
let lineArr: any = []
let LngLatArray2: any = [];
// lineArr2 = []
var size: number = 40;
var convertNum = 0;
var count = state.car_data.length;
//聚合点样式
var _renderClusterMarker = function (context) {
let data: any = context.clusterData[0].extData
var div = document.createElement("div");
var fontColor = "hsla(120,50%,0%,1)";
div.style.width = "37px";
div.style.height = "46px";
div.innerHTML = context.count;
div.style.lineHeight = size + "px";
div.style.color = fontColor;
div.style.fontSize = "14px";
div.style.textAlign = "center";
//自定义显示maker 的图标
div.style.backgroundImage = "url(自己图片的地址 网图)"
context.marker.setOffset(new AMap.Pixel(-size / 2, -size / 2));
context.marker.setContent(div);
context.marker.on('click', function (e) {
var curZoom = map.getZoom();
if (curZoom < 20) {
curZoom += 1;
}
map.setZoomAndCenter(curZoom, e.lnglat);
});
};
//非聚合点样式
var _renderMarker = function (context) {
let data: any = context.data[0].extData
let content = '<div style=" height: 35px;width:30px"><img src="http://file_upload.suntaeiv.com:50000/file_management/db/bc267af5b56e6b09a9263c1f9cab70cc0b814d.png" style="width: 100%;height:100%"/></div>';
context.marker.setLabel({
direction: 'bottom',
offset: new AMap.Pixel(0, 0), //设置文本标注偏移量
content: "<div class='info'> <span class='info_right'>" + data.license_plate_number + " " + "</span><span>" + " " + data.car_speed + 'km/h' + "</span></div>", //设置文本标注内容
});
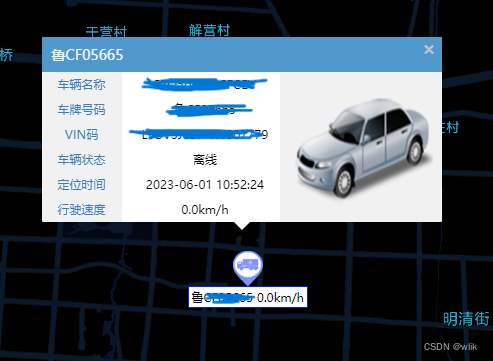
context.marker.on('click', function () {
var info: any = [];
info.push("<div style='box-shadow: 0 4px 8px 0 rgba(0, 0, 0, 0.2), 0 6px 20px 0 rgba(0, 0, 0, 0.19);'>")
info.push("<div style='height: 35px;display: flex; width: 400px; align-items: center; justify-content: space-between;background-color: #4997cf;color: aliceblue;'>")
info.push("<div style='margin-left: 10px;'>" + data.license_plate_number + "</div>")
info.push("<div style='margin-right: 10px;'><el-icon> <Close /></el-icon></div></div>")
info.push("<div style='display: flex; width: 400px;'>")
info.push("<div style='font-size: 11px;color:#357abd;height: 150px;width: 130px;'>")
info.push("<div class='form_info_font'> 车辆名称 </div> <div class='form_info_font'> 车牌号码 </div> <div class='form_info_font'> VIN码 </div> <div class='form_info_font'>车辆状态</div> <div class='form_info_font'> 定位时间 </div><div class='form_info_font'> 行驶速度 </div> </div>")
info.push("<div style='font-size: 11px;color:#000;height: 150px;width: 170px;'> <div class='form_info_font1'> " + data.car_name + "</div> <div class='form_info_font1'>" + data.license_plate_number + " </div> <div class='form_info_font1'>" + data.vin + "</div> <div class='form_info_font1'> " + data.online_status + "</div> <div class='form_info_font1'>" + data.positioning_time + " </div> <div class='form_info_font1'> " + data.car_speed + "km/h </div> </div>")
info.push("<div style='background-color: #f1f1f1;height: 150px;'>")
info.push("<img src='http://116.62.42.241/gps-web/rs/img/car/bigs/%E8%BD%BF%E8%BD%A6/1.png' style='width: 100%;height:100%'/></div>")
// info.push("</div><div style='font-size:11px; height:30px;display:flex;align-items: center;'><div onclick='win_info(1)' style='margin-left:10px'>轨迹</div><div onclick='win_info(2)' style='margin-left:10px'>详情</div><div onclick='win_info(3)' style='margin-left:10px'>跟踪车辆</div> </div></div>")
infoWindow = new AMap.InfoWindow({
offset: new AMap.Pixel(0, -30),
content: info.join("") //使用默认信息窗体框样式,显示信息内容
});
infoWindow.open(map, context.marker.getPosition());
});
var offset = new AMap.Pixel(-9, -9);
context.marker.setContent(content);
context.marker.setOffset(offset);
};
const MarkerCluster = (data: any) => {
var gridSize = 40;
var cluster = new AMap.MarkerCluster(map, data, {
gridSize: gridSize,
renderClusterMarker: _renderClusterMarker, // 自定义聚合点样式
renderMarker: _renderMarker, // 自定义非聚合点样式
});
};
//处理数据 从接口获得的数据 拿出 经纬度
for (let i = 0; i < state.car_data.length; i++) {
lat = state.car_data[i].latitude
lng = state.car_data[i].longitude
if (lat != '0') {
lineArr.push(new AMap.LngLat(lng, lat))
}
}
// 进行批量 gps 转高德坐标点
let pageNum = parseInt((lineArr.length + size - 1) / size + '');
const convert = (LngLatArray: any) => {
AMap.convertFrom(LngLatArray, 'gps', function (status: any, result: any) {
if (result.info === "ok" && status == 'complete') {
var resLnglat = result.locations[0];
console.log(result.locations.length);
//这里是重点 extData 把你要在maker 上显示的数据
//塞在里面 1对1 对应好 这里赋空值在下面赛
for (let index = 0; index < result.locations.length; index++) {
LngLatArray2.push({
weight: '',
lnglat: [result.locations[index].lng, result.locations[index].lat],
extData: ""
})
}
convertNum++;
if (convertNum >= pageNum) {
for (let index = 0; index < LngLatArray2.length; index++) {
LngLatArray2[index].extData = state.car_data[index];
}
// const combinedArr = LngLatArray2.concat(factoryArray, hydrogenArray);
MarkerCluster(LngLatArray2);
}
}
});
}
for (var i = 0; i < pageNum; i++) {
var LngLatArraySlice = lineArr.slice(i * size, (i + 1) * size);
convert(LngLatArraySlice);
}
})
}3.这里重点分析 讲解一下
高德地图api2.0 以后 不能MarkerCluster 只能传入
不再像以前可以传 maker 数组,可以把对应数据的标识赛在maker 的title中 ,相当于添加一个唯一标识,然后去匹配数据,而是只能塞入上方图片的数组,所以无法做到点击maker 拿到该maker对应的信息,所以有了新的数据形式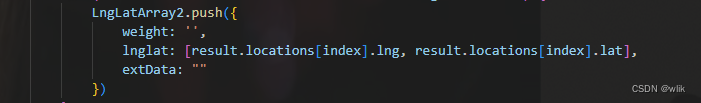
构建这样一个数组 weight是权重,这里没用到就不解释了,extData 可以存入你要显示的数据,
然后自定义聚合点样式
let data: any = context.clusterData[0].extData和非聚合点样式
let data: any = context.data[0].extData这样就可以获取到每个maker 中存入相对应的数据进行 信息窗体的显示
3.自定义点聚合的样式
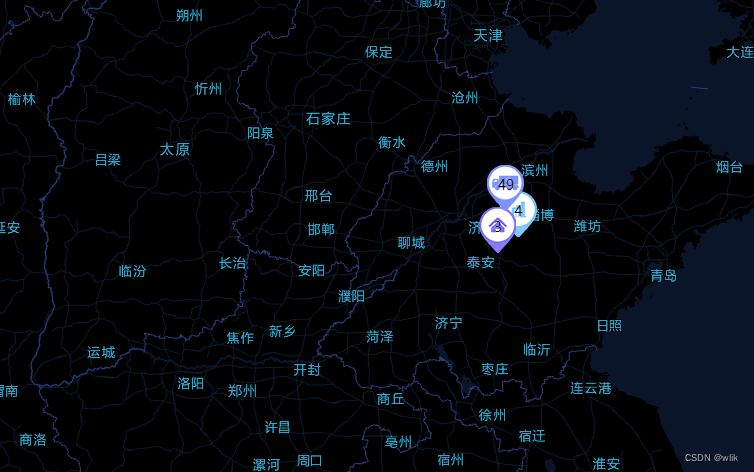
4.点击maker 显示窗体 显示自己需要显示的信息


 1664
1664

 被折叠的 条评论
为什么被折叠?
被折叠的 条评论
为什么被折叠?
 到【灌水乐园】发言


