


要求:
- 纵坐标刻度线对齐;
- 刻度间隔为5;
- 去掉千位默认的逗号;
- 刻度最小是0.
效果图: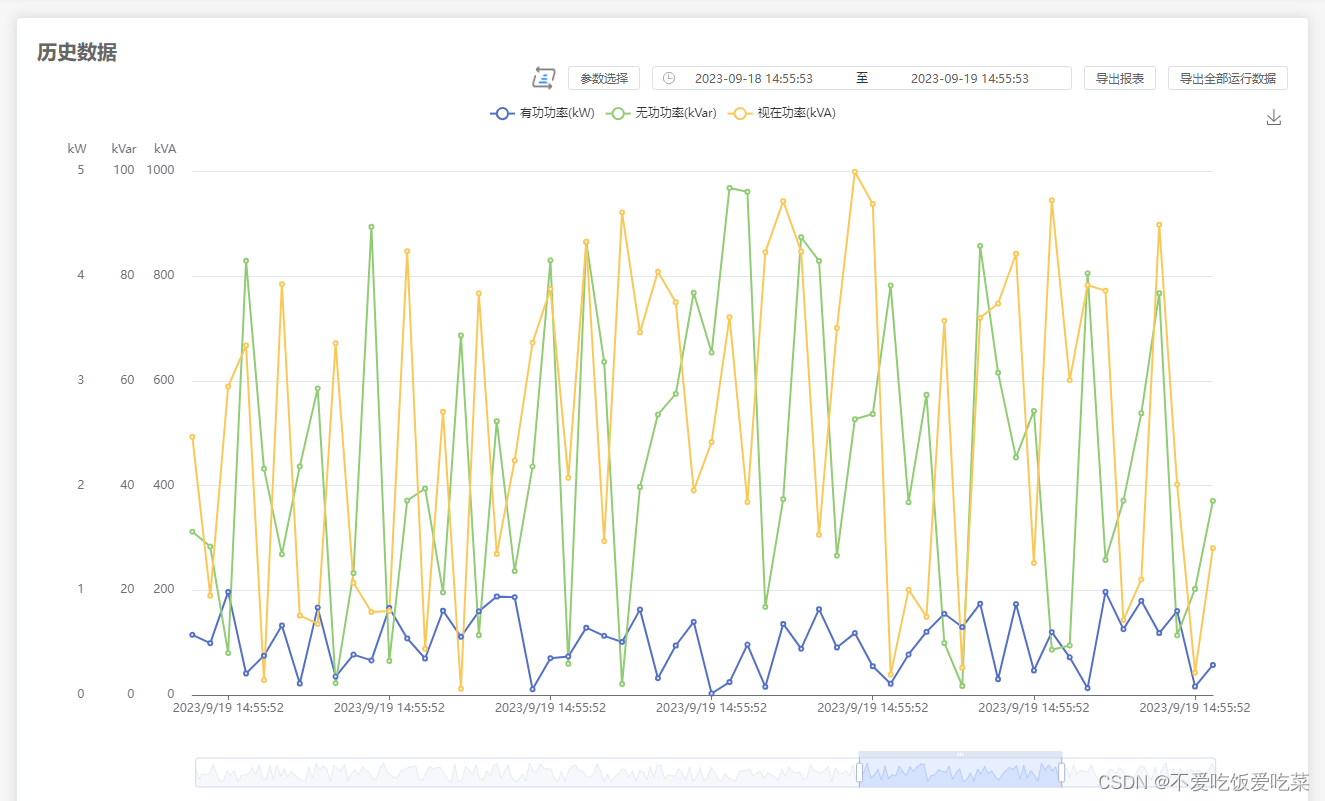
代码:
    yAxis: [
      {
        type: "value",
        position: "left",
        name: "kW",
        offset: 100,
        nameTextStyle: { align: "right", padding: [0, 6, 0, 0] },
        splitLine: {
          show: true,
        },
        min: 0, //最小是00
        splitNumber: 5, //刻度间隔为5,5个刻度线,分割段数
        interval: Math.ceil(Math.ceil(Math.max(...data.activeList)) / 5), //interval强制设置坐标轴分割间隔,控制两边刻度比例一样才能保持刻度线对齐
        max: Math.ceil(Math.ceil(Math.max(...data.activeList)) / 5) * 5, //设置的max一定是大于或等于数据最大值,计算找出数据中最大值向上取整
        axisLabel: { //去掉千位默认的逗号
          formatter: function (value) {
            return value + "";
          },
        },
      },
    ],
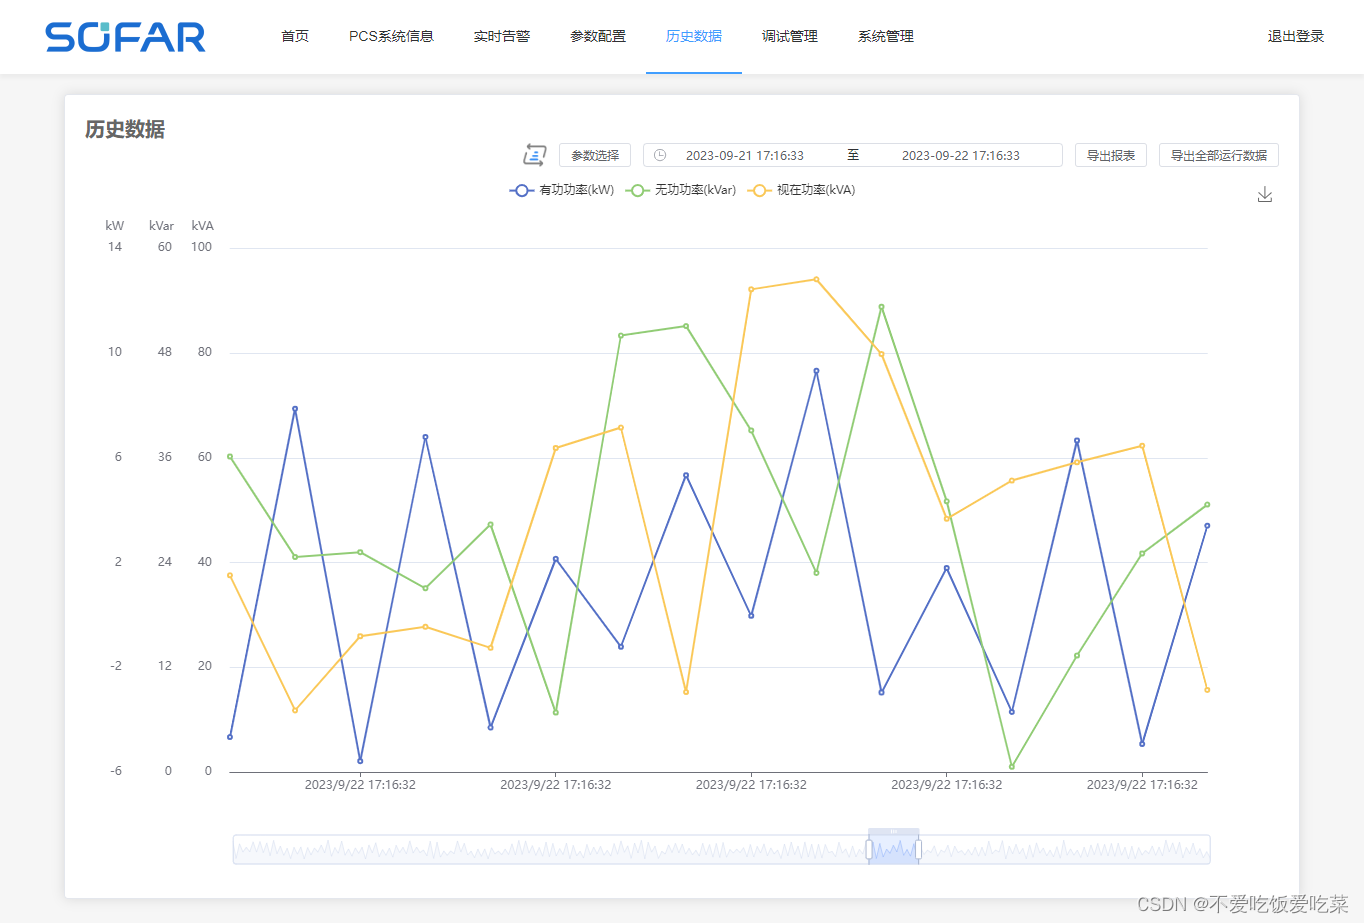
要求:
- 刻度最小不是0,是负数的情况
效果图:
代码:
    yAxis: [
      {
        type: "value",
        position: "left",
        name: "kW",
        offset: 100,
        nameTextStyle: { align: "right", padding: [0, 6, 0, 0] },
        splitLine: {
          show: true,
        },
        splitNumber: 5, //刻度间隔为5,5个刻度线,分割段数
        interval: Math.abs( //根据数据计算间隔
          Math.ceil(
            (Math.ceil(Math.max(...data.activeList)) -
              Math.floor(Math.min(...data.activeList))) /
              5
          )
        ),
        max: //根据数据计算最大值
          Math.floor(Math.min(...data.activeList)) +
          Math.abs(
            Math.ceil(
              (Math.ceil(Math.max(...data.activeList)) -
                Math.floor(Math.min(...data.activeList))) /
                5
            )
          ) *
            5,
        min: Math.floor(Math.min(...data.activeList)), //根据数据计算最小
        // 去除千位默认的逗号
        axisLabel: {
          formatter: function (value) {
            return value + "";
          },
        },
      },
    ],


 1111
1111


 被折叠的 条评论
为什么被折叠?
被折叠的 条评论
为什么被折叠?
 到【灌水乐园】发言


