


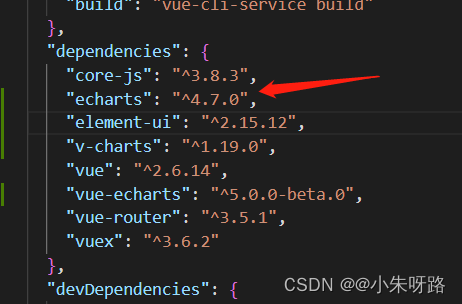
1.echarts的版本是4.7的
html书写方式
<!DOCTYPE html>
<html lang="en">
<head>
<meta charset="UTF-8" />
<meta http-equiv="X-UA-Compatible" content="IE=edge" />
<meta name="viewport" content="width=device-width, initial-scale=1.0" />
<title>Document</title>
<script src="https://cdn.jsdelivr.net/npm/echarts@4.7.0/dist/echarts.js"></script>
</head>
<body>
<div id="main" style="width: 600px; height: 400px"></div>
<script>
var mychart = echarts.init(document.getElementById("main"));
var option = {
title: {},
xAxis: { type: "category",
show: false ,
boundaryGap: false,//false紧贴着y轴的刻度线 true离开y轴刻度线
},
yAxis: { show: false },
series: [
{
itemStyle: {
opacity: 0,
},
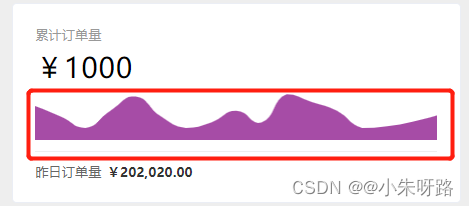
areaStyle: { color: "purple" },
lineStyle: { width: 0 },
smooth: true,
type: "line",
grid: {
top: 0,
left: 0,
bottom: 0,
right: 0,
},
data: [
620, 434, 220, 534, 790, 430, 220, 320, 532, 320, 834, 690, 530,
220, 250, 330, 450,
],
},
],
};
mychart.setOption(option);
</script>
</body>
</html>
vue的echarts书写方式
cnpm 安装
cnpm install echarts@4.7.0
main.js引入
import echarts   from 'echarts'
Vue.prototype.$echarts=echarts ;
<template>
  <div id="main" style="width: 50%; height: 200px; border: 1px solid red"></div>
</template>

<script>
export default {
  data() {
    return {};
  },
  mounted() {
   this.setchart()
  },
  methods:{
    setchart(){
       var myecharts = this.$echarts.init(document.getElementById("main"));
       var option = {
       title: {},
       xAxis: {
        type: "category",
        show: false,
		boundaryGap: false,//false紧贴着y轴的刻度线 true离开y轴刻度线
	  },
       yAxis: { show: false },
       series: [
        {
          itemStyle: {
            opacity: 0,
          },
          areaStyle: { color: "purple" },
          lineStyle: { width: 0 },
          smooth: true,
          type: "line",
          grid: {
            top: 0,
            left: 0,
            bottom: 0,
            right: 0,
          },
          data: [
            620, 434, 220, 534, 790, 430, 220, 320, 532, 320, 834, 690, 530,
            220, 250, 330, 450,
          ],
        },
      ],
    };
    myecharts.setOption(option);
	}
  }
};
</script>

<style lang="scss" scoped></style>
v-chart的用法(vue-echarts)
安装:
 "vue-echarts": "^5.0.0-beta.0",
 cnpm  install vue-echarts@5.0.0-beta.0
引入
import VueECharts from 'vue-echarts'
Vue.component('v-chart', VueECharts)
<template>
  <div id="main" style="width: 50%; height: 200px; border: 1px solid red">
    <v-chart :options="add()"></v-chart>
  </div>
</template>

<script>
export default {
  data() {
    return {};
  },
  methods: {
    add() {
      return {
        title: {},
        xAxis: {
         type: "category",
         show: false,
		 boundaryGap: false,//false紧贴着y轴的刻度线 true离开y轴刻度线
	   },
        yAxis: { show: false },
        series: [
          {
            itemStyle: {
              opacity: 0,
            },
            areaStyle: { color: "purple" },
            lineStyle: { width: 0 },
            smooth: true,
            type: "line",
            grid: {
              top: 0,
              left: 0,
              bottom: 0,
              right: 0,
            },
            data: [
              620, 434, 220, 534, 790, 430, 220, 320, 532, 320, 834, 690, 530,
              220, 250, 330, 450,
            ],
          },
        ],
      };
    },
  },

};
</script>

<style lang="scss" scoped>
/* 设置修改vue-charts的宽高 */
.echarts {
    width: 100% !important;
    height: 100% !important;
}

</style>


 2615
2615


 被折叠的 条评论
为什么被折叠?
被折叠的 条评论
为什么被折叠?
 到【灌水乐园】发言


