?mtcars
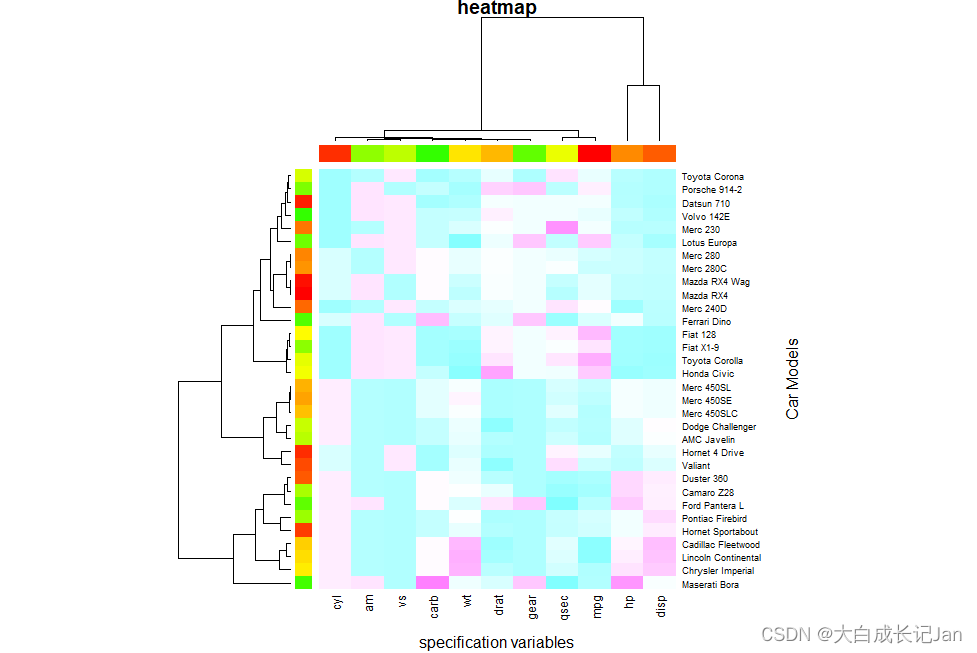
x <- as.matrix(mtcars)
rc <- rainbow(nrow(x), start =0,end=.3)
cc <- rainbow(ncol(x), start =0,end=.3)
hv <- heatmap(x, col = cm.colors(256),
scale ="column",
RowSideColors = rc,
ColSideColors = cc,
margins = c(5,10),
xlab ="specification variables",
ylab ="Car Models",
main ="heatmap")
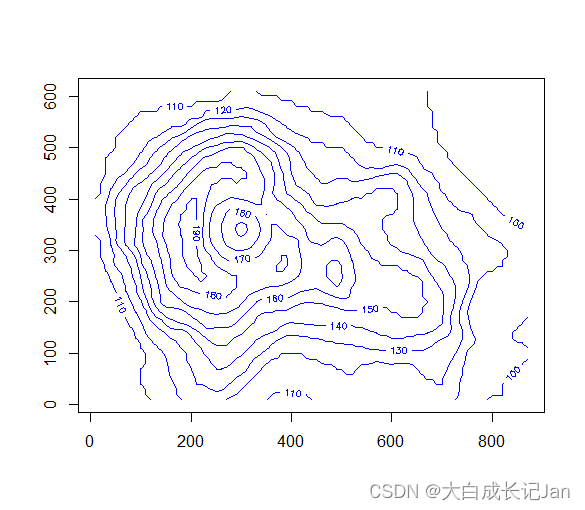
7.等值线图
?volcano
(x <-10*1:nrow(volcano))(y <-10*1:ncol(volcano))
contour(x, y, volcano, col ="blue", lty ="solid",
vfont = c("sans serif","plain"))
8.栅格图image
x <-10*1:nrow(volcano)
y <-10*1:ncol(volcano)#par(mfrow=c(1,2), mar=rep(1,4),ann=F)#image(x, y, volcano, col=terrain.colors(100), axes=F) #绘制image图,并设置颜色#box(lwd=2)
image(x, y, volcano, col=terrain.colors(100), xlab="",ylab="")
contour(x, y, volcano, nlevels=10, lwd=1.5, add=T)#将等高线叠加在上面
box(lwd=2)


 3494
3494


 被折叠的 条评论
为什么被折叠?
被折叠的 条评论
为什么被折叠?
 到【灌水乐园】发言


