


前言
输入数据生成坐标轴
一、代码
package main

import (
	"encoding/json"
	"fmt"
	"github.com/go-echarts/go-echarts/v2/charts"
	"github.com/go-echarts/go-echarts/v2/components"
	"github.com/go-echarts/go-echarts/v2/opts"
	"github.com/go-toast/toast"
	"io"
	"io/ioutil"
	"log"
	"os"
	"path/filepath"
	"strconv"
	"time"
)

var folderPath string
var ecPath string

func genLine3dData(s []int) []opts.LineData {
	data := make([][2]int, 0)
	for index, value := range s {
		data = append(data, [2]int{index, value})
	}
	ret := make([]opts.LineData, 0, len(data))
	for _, d := range data {
		ret = append(ret, opts.LineData{Value: []interface{}{d[0], d[1]}})
	}
	return ret
}

func line3DBase(s Info) *charts.Line {
	var a opts.AxisPointer
	a.Type = "line"
	a.Snap = true
	line := charts.NewLine()
	line.SetGlobalOptions(
		charts.WithTitleOpts(opts.Title{Title: s.Title}),
		charts.WithTooltipOpts(opts.Tooltip{
			Show:        true,
			Trigger:     "axis",
			TriggerOn:   "",
			Formatter:   "",
			AxisPointer: &a,
		}),
	)
	line.AddSeries("", genLine3dData(s.Data))
	line.SetSeriesOptions(charts.WithLineChartOpts(opts.LineChart{
		Smooth: true,
	}))

	return line
}

func unixToStr(timeUnix int64, layout string) string {
	timeStr := time.Unix(timeUnix, 0).Format(layout)
	return timeStr
}
func main() {
	path, _ := os.Getwd()
	infos := getProperties(path)
	var count = 0
	for _, info := range infos {

		count++
		create(info, path)
	}
	//创建assets文件

	//copy一份js到
	ecPath = filepath.Join(filepath.Join(path, "assets"), "ec.jsecharts.min.js")
	join := filepath.Join(folderPath, "assets")
	os.Mkdir(join, 0777)
	// 再修改权限
	os.Chmod(join, 0777)
	//c path
	cpath := filepath.Join(join, "ec.jsecharts.min.js")
	os.Create(cpath)

	CopyFile(cpath, ecPath)

	str := "生成结束,共生成" + strconv.Itoa(count) + "张图像"
	notification := toast.Notification{
		AppID:   "Microsoft.Windows.Shell.RunDialog",
		Title:   "智能画图",
		Message: str,
	}
	err := notification.Push()
	if err != nil {
		log.Fatalln(err)
	}

}
func CopyFile(dst, src string) {
	data, err := ioutil.ReadFile(src)
	if err != nil {
		fmt.Println("err 有", err)
		return
	}
	err = ioutil.WriteFile(dst, data, 0666)
	if err != nil {
		fmt.Println("写文件出错了", err)
	}
}

func create(s Info, path string) {
	page := components.NewPage()
	page.AddCustomizedCSSAssets()
	page.AddCharts(
		line3DBase(s),
	)
	nowUnix := time.Now().Unix() //获取当前时间戳
	nowStr := unixToStr(nowUnix, "2006-01-02")

	folderPath = filepath.Join(path, nowStr+"曲线图")

	os.Mkdir(folderPath, 0777)
	// 再修改权限
	os.Chmod(folderPath, 0777)

	folderPath1 := filepath.Join(folderPath, s.Title+".html")

	f, err := os.Create(folderPath1)
	if err != nil {
		panic(err)
	}
	page.Render(io.MultiWriter(f))
}
func getProperties(path string) []Info {
	path = path + "/info.json"
	fileHanle, _ := os.OpenFile(path, os.O_RDONLY, 0666)
	defer fileHanle.Close()
	// 按行处理txt
	all, _ := ioutil.ReadAll(fileHanle)
	var infos = make([]Info, 1)
	json.Unmarshal(all, &infos)
	return infos
}

type Info struct {
	Title string `json:"title,omitempty"`
	Data  []int  `json:"data,omitempty"`
}
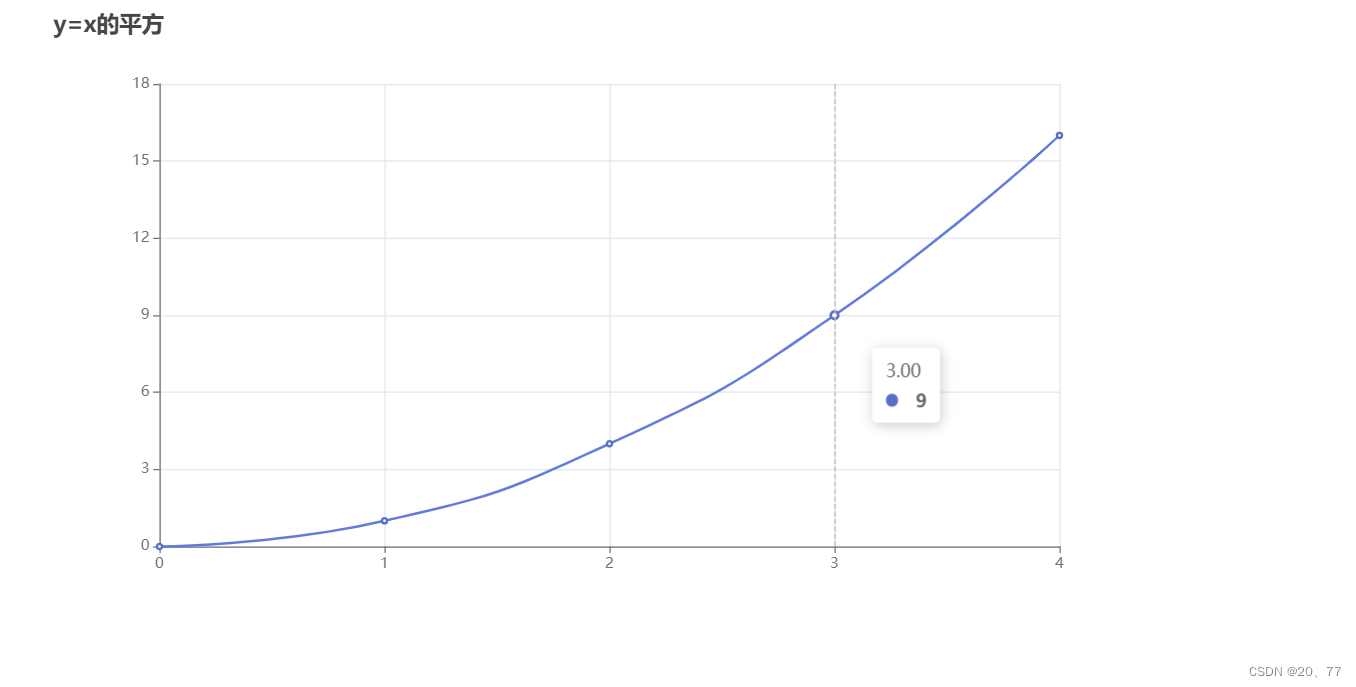
二、info.json
[
  {"title":"y=x", "data":[1,2,3,4,5,6,7,8,9,10]},
  {"title":"y=2x", "data":[2,4,6,8,10]},
  {"title":"y=x的平方", "data":[0,1,4,9,16]}
]
三、图片
四、改进
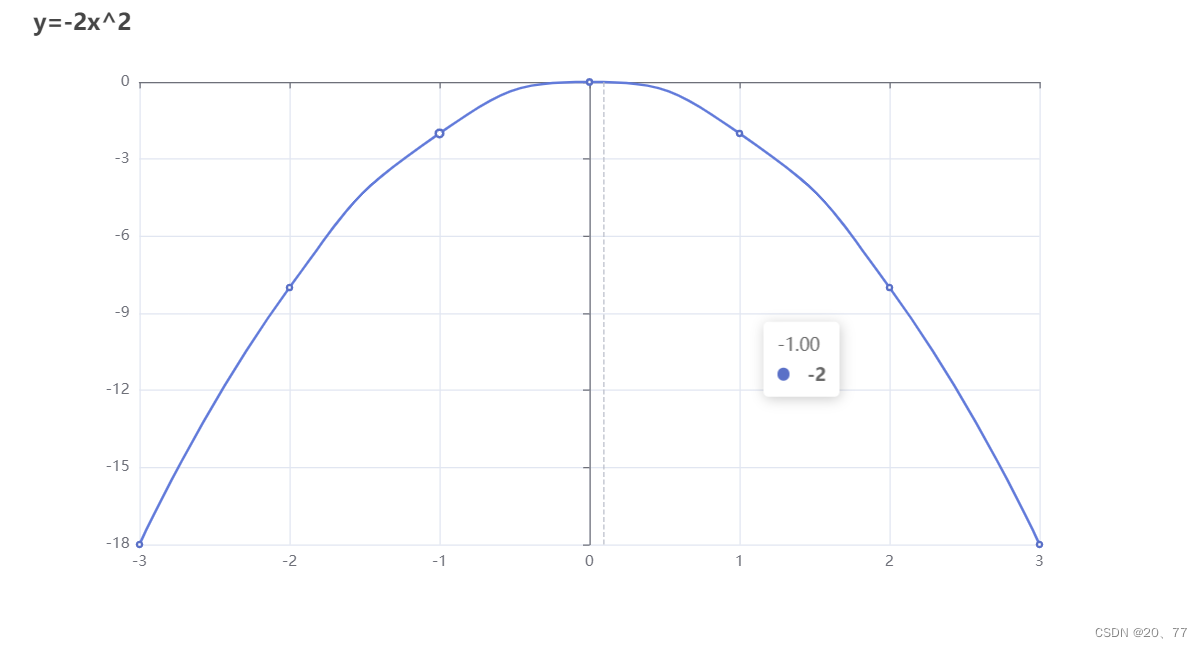
只有正坐标系是不符合宝老师的要求的,进行改进
package main

import (
	"encoding/json"
	"fmt"
	"github.com/go-echarts/go-echarts/v2/charts"
	"github.com/go-echarts/go-echarts/v2/components"
	"github.com/go-echarts/go-echarts/v2/opts"
	"github.com/go-toast/toast"
	"io"
	"io/ioutil"
	"log"
	"os"
	"path/filepath"
	"strconv"
	"time"
)

var folderPath string
var ecPath string

func genLine3dData(s []int, m bool) []opts.LineData {
	data := make([][2]int, 0)

	for i := len(s) - 1; i >= 0; i-- {
		var ss = s[i]
		if !m {
			ss = -s[i]
		}
		data = append(data, [2]int{-i, ss})
	}

	for index, value := range s {
		data = append(data, [2]int{index, value})
	}

	ret := make([]opts.LineData, 0, len(data))
	for _, d := range data {
		ret = append(ret, opts.LineData{Value: []interface{}{d[0], d[1]}})
	}
	return ret
}

func line3DBase(s Info) *charts.Line {
	var a opts.AxisPointer
	a.Type = "line"
	a.Snap = true
	line := charts.NewLine()
	line.SetGlobalOptions(
		charts.WithTitleOpts(opts.Title{Title: s.Title}),
		charts.WithTooltipOpts(opts.Tooltip{
			Show:        true,
			Trigger:     "axis",
			TriggerOn:   "",
			Formatter:   "",
			AxisPointer: &a,
		}),
	)
	line.AddSeries("", genLine3dData(s.Data, s.Mark))
	line.SetSeriesOptions(charts.WithLineChartOpts(opts.LineChart{
		Smooth: true,
	}))

	return line
}

func unixToStr(timeUnix int64, layout string) string {
	timeStr := time.Unix(timeUnix, 0).Format(layout)
	return timeStr
}
func main() {
	path, _ := os.Getwd()
	infos := getProperties(path)
	var count = 0
	for _, info := range infos {

		count++
		create(info, path)
	}
	//创建assets文件

	//copy一份js到
	ecPath = filepath.Join(filepath.Join(path, "assets"), "ec.jsecharts.min.js")
	join := filepath.Join(folderPath, "assets")
	os.Mkdir(join, 0777)
	// 再修改权限
	os.Chmod(join, 0777)
	//c path
	cpath := filepath.Join(join, "ec.jsecharts.min.js")
	os.Create(cpath)

	CopyFile(cpath, ecPath)

	str := "生成结束,共生成" + strconv.Itoa(count) + "张图像"
	notification := toast.Notification{
		AppID:   "Microsoft.Windows.Shell.RunDialog",
		Title:   "智能画图",
		Message: str,
	}
	err := notification.Push()
	if err != nil {
		log.Fatalln(err)
	}

}
func CopyFile(dst, src string) {
	data, err := ioutil.ReadFile(src)
	if err != nil {
		fmt.Println("err 有", err)
		return
	}
	err = ioutil.WriteFile(dst, data, 0666)
	if err != nil {
		fmt.Println("写文件出错了", err)
	}
}

func create(s Info, path string) {
	page := components.NewPage()
	page.AddCustomizedCSSAssets()
	page.AddCharts(
		line3DBase(s),
	)
	nowUnix := time.Now().Unix() //获取当前时间戳
	nowStr := unixToStr(nowUnix, "2006-01-02")

	folderPath = filepath.Join(path, nowStr+"曲线图")

	os.Mkdir(folderPath, 0777)
	// 再修改权限
	os.Chmod(folderPath, 0777)

	folderPath1 := filepath.Join(folderPath, s.Title+".html")

	f, err := os.Create(folderPath1)
	if err != nil {
		panic(err)
	}
	page.Render(io.MultiWriter(f))
}
func getProperties(path string) []Info {
	path = path + "/info.json"
	fileHanle, _ := os.OpenFile(path, os.O_RDONLY, 0666)
	defer fileHanle.Close()
	// 按行处理txt
	all, _ := ioutil.ReadAll(fileHanle)
	var infos = make([]Info, 1)
	json.Unmarshal(all, &infos)
	return infos
}

type Info struct {
	Title string `json:"title"`
	Data  []int  `json:"data"`
	Mark  bool   `json:"mark"`
}
五、info.json
[
  {"title":"y=x", "data":[0,1,2,3,4,5,6,7,8,9,10], "mark":false},
  {"title":"y=2x", "data":[0,2,4,6,8,10], "mark":false},
  {"title":"y=x的平方", "data":[0,1,4,9,16], "mark":true},
  {"title":"y=-2x^2", "data":[0,-2,-8,-18], "mark":true}
]
六、图片


 283
283


 被折叠的 条评论
为什么被折叠?
被折叠的 条评论
为什么被折叠?
 到【灌水乐园】发言


