


利用m_gshhs_X 命令,其中X=c,l,i,h,f,
分别代表 crude & low & intermediate & high & full
CG的toolbox有高精度的数据集
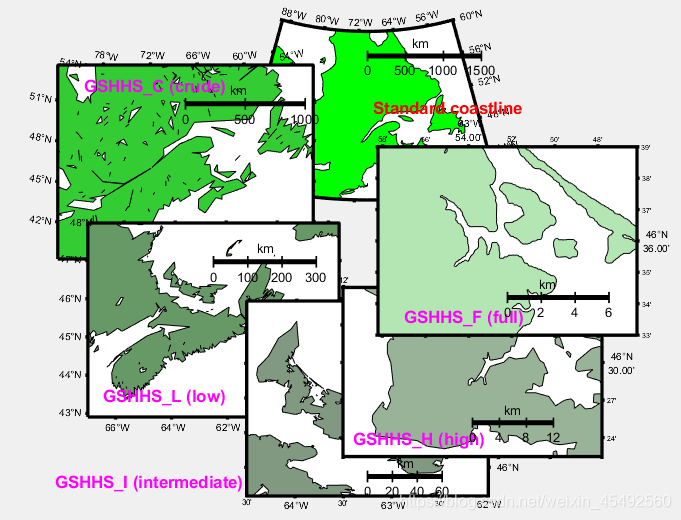
% Example showing the default coastline and all of the different resolutions
% of GSHHS coastlines as we zoom in on a section of Prince Edward Island.
%岸线
    clf
    %画图之前清除图形
    axes('position',[.35 .6 .37 .37]);
    %m_proj('albers equal-area','lat',[40 60],'long',[-90 -50],'rect','on');
    m_proj('albers equal-area','lat',[40 60],'long',[-90 -50]);
    %投影,rect?投影转换
    m_coast('patch',[0 1 0]);
    m_grid('linestyle','none','linewidth',2,'tickdir','out',...
           'xaxisloc','top','yaxisloc','right','fontsize',6);
    m_text(-69,51,'Standard coastline','color','r','fontweight','bold');
    m_ruler([.5 .9],.8,3,'fontsize',8)

    axes('position',[.09 .5 .37 .37]);
    m_proj('albers equal-area','lat',[40 54],'long',[-80 -55],'rect','on');
    m_gshhs_c('patch',[.2 .8 .2]);
    m_grid('linestyle','none','linewidth',2,'tickdir','out',...
           'xaxisloc','top','fontsize',6);
    m_text(-80,52.5,'GSHHS\_C (crude)','color','m','fontweight','bold');
    m_ruler([.5 .9],.8,2,'fontsize',8);

    axes('position',[.13 .2 .37 .37]);
    m_proj('albers equal-area','lat',[43 48],'long',[-67 -58],'rect','on');
    m_gshhs_l('patch',[.4 .6 .4]);
    m_grid('linestyle','none','linewidth',2,'tickdir','out','fontsize',6);
    m_text(-66.5,43.5,'GSHHS\_L (low)','color','m','fontweight','bold');
    m_ruler([.5 .9],.8,3,'fontsize',8);

    axes('position',[.35 .05 .37 .37]);
    m_proj('albers equal-area','lat',[45.8 47.2],'long',[-64.5 -62],'rect','on');
    m_gshhs_i('patch',[.5 .6 .5]);
    m_grid('linestyle','none','linewidth',2,'tickdir','out',...
           'yaxisloc','right','fontsize',6);
    m_text(-64.4,45.9,'GSHHS\_I (intermediate)   ','color','m',...
          'fontweight','bold','horizontalalignment','right');
    m_ruler([.5 .8],.1,3,'fontsize',8);

    axes('position',[.5 .1 .37 .37]);
    m_proj('albers equal-area','lat',[46.375 46.6],'long',[-64.2 -63.7],'rect','on');
    m_gshhs_h('patch',[.6 .7 .6]);
    m_grid('linestyle','none','linewidth',2,'tickdir','out',...
           'xaxisloc','top','yaxisloc','right','fontsize',6);
    m_text(-64.18,46.4,'GSHHS\_H (high)','color','m','fontweight','bold');
    m_ruler([.5 .8],.2,3,'fontsize',8);

    axes('position',[.55 .35 .37 .37]);
    m_proj('albers equal-area','lat',[46.55 46.65],'long',[-63.97 -63.77],'rect','on');
    m_gshhs_f('patch',[.7 .9 .7]);
    m_grid('linestyle','none','linewidth',2,'tickdir','out',...
           'xaxisloc','top','yaxisloc','right','fontsize',6);
    m_text(-63.95,46.56,'GSHHS\_F (full)','color','m','fontweight','bold');
    m_ruler([.5 .8],.2,3,'fontsize',8);
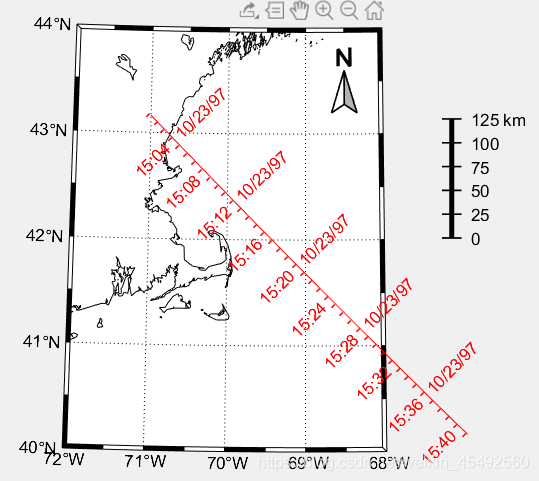
    m_proj('UTM','long',[-72 -68],'lat',[40 44]);
    %设置投影
    m_gshhs_i('color','k');
    %加密海岸线
    m_grid('box','fancy','tickdir','in');
    %外边框
    m_ruler(1.2,[.5 .8]);
    %图例
    % fake up a trackline
    lons=[-71:.1:-67];
    lats=60*cos((lons+115)*pi/180);
    dates=datenum(1997,10,23,15,1:41,zeros(1,41));

    m_track(lons,lats,dates,'ticks',0,'times',4,'dates',8,...
           'clip','off','color','r','orient','upright');

    m_northarrow(-68.5,43.4,.4,'type',2);
    %指南针


 1679
1679

 被折叠的 条评论
为什么被折叠?
被折叠的 条评论
为什么被折叠?
 到【灌水乐园】发言


