


前言
因为要做一个和ArcGIS相关的项目,所以记录一下自己的学习过程。
我使用的版本 :
VScode
vue-cli 版本:4.5.13
ArcGIS API for JavaScript 文档(4.20版本): ArcGIS API for JavaScript
主要还是跟着文档走
正文
有多种方式来将ArcGIS API for JavaScript引入自己的应用程序中,我是通过ES模块来构建的项目。
1. 先安装模块。
npm install @arcgis/core
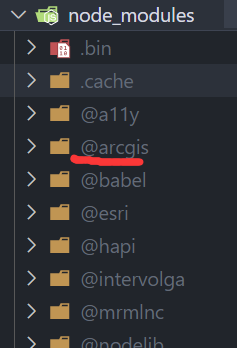
安装之后看一下node_modules文件夹中是否有@arcgis和@esri,有就表示安装成功。
2. 加载模块
创建新组件MapView,引入Map和MapView:
import Map from '@arcgis/core/Map'
import MapView from '@arcgis/core/views/MapView'
3. 创建地图
const myMap = new Map({
      basemap: "streets-vector"
    })
地图实例就是一个包含图层的简单容器,还有其它的属性和方法。
Map类文档
4. 创建二维视图
const view = new MapView({
      container: "viewDiv", // Reference to the DOM node that will contain the view
      map: myMap, // References the map object created in step 3
      zoom: 7, // Sets zoom level based on level of detail (LOD)
      center: [15, 65] // Sets center point of view using longitude,latitude
    })
view.when(function(){
      alert('地图加载完毕')
    // All the resources in the MapView and the map have loaded. Now execute additional processes
    }, function(error){
    // Use the errback function to handle when the view doesn't load properly
    console.log("The view's resources failed to load: ", error);
创建MapView的实例必须至少有两个对象,一个是Map实例和DOM元素,分别再map属性和container属性设置。MapView 和地图中的所有资源都已加载,.when()就可以执行额外的进程
5. 设计页面
 <div id="viewDiv">
 </div>
 #viewDiv {
    width: 100%;
    height: 100%;
  }
最后展示完整代码:
组件代码:
<template>
 <div id="viewDiv">
 </div>
</template>

<script>
import Map from '@arcgis/core/Map'
import MapView from '@arcgis/core/views/MapView'
export default {
  data () {
    return {
      Map,
      MapView
    }
  },
  mounted () {
    const myMap = new Map({
      basemap: "streets-vector"
    })
    const view = new MapView({
      container: "viewDiv", // Reference to the DOM node that will contain the view
      map: myMap, // References the map object created in step 3
      zoom: 7, // Sets zoom level based on level of detail (LOD)
      center: [15, 65] // Sets center point of view using longitude,latitude
    })
    view.when(function(){
      alert('地图加载完毕')
    // All the resources in the MapView and the map have loaded. Now execute additional processes
    }, function(error){
    // Use the errback function to handle when the view doesn't load properly
    console.log("The view's resources failed to load: ", error);
});
  },
  components: {

  }
}
</script>

<style>
 #viewDiv {
    width: 100%;
    height: 100%;
  }
</style>
App.vue代码
<template>
  <div id="app">
    <MapView/>
  </div>
</template>

<script>
import MapView from './components/MapView.vue'
export default {
  name: 'App',
  components: {
    MapView
  }
}
</script>

<style>
  html,body,#app{
    height: 100%;
  }
</style>


 1340
1340


 被折叠的 条评论
为什么被折叠?
被折叠的 条评论
为什么被折叠?
 到【灌水乐园】发言


