


图表组件
ECharts,全称为Enterprise Charts,是一个使用JavaScript实现的开源可视化库。它主要用于数据可视化领域,能够方便地创建出直观、交互性强的图表。ECharts由百度团队开发,目前是Apache的顶级项目之一。ECharts支持的图表类型非常丰富,包括但不限于柱状图、折线图、饼图、散点图、雷达图、地图、热力图、树图、桑基图等多种。ECharts的设计哲学是可高度定制化和拓展性好,能够满足多种数据可视化需求。
ECharts的主要特点
- 丰富的图表类型:ECharts提供了丰富的图表类型,能够满足大部分数据可视化需求。
- 高度可定制:用户可以通过配置项自定义图表的各个元素,如色彩、字体、样式等,满足个性化展示需求。
- 良好的交互性:ECharts支持图表的交互操作,如缩放、拖拽、点击等,提高用户体验。
- 强大的性能:利用zrender作为渲染引擎,优化渲染算法,即使是大数据量也能保证较好的性能。
- 多端适应:支持基于HTML5的Web标准,可在PC和移动设备上使用。
- 国际化:ECharts支持多国语言,方便国际化项目使用。
安装命令如下:
cd bingo_web  # 注意,客户端安装模块的所有命令,务必在package.json所在目录下操作。
npm config set strict-ssl true
npm install echarts --save --registry=https://registry.npm.taobao.org
安装完成以后,直接可以在src/views/Bingo.vue页面组件中进行使用Echarts基本示例查看效果。
你遇到的错误信息 "Initialize failed: invalid dom." 指示 ECharts 试图在一个无效的 DOM 元素上进行初始化。这个问题通常是因为在试图初始化 ECharts 实例的时候,对应的 DOM 元素还没有被渲染或不可见,导致 ECharts 无法找到这个元素。
在你的代码中的以下部分:
var myChart = echarts.init(document.getElementById('main'));
你试图使用 document.getElementById('main') 来获取 DOM 元素,但在 Vue 应用中并不存在一个 id="main" 的元素。另外,由于你使用了 Vue 组合式API (<script setup> 标签),直接操作 DOM 可能不是最佳实践。
为了解决这个问题,并且以 Vue 的方式来正确地使用 ECharts,你可以按照以下步骤来修改你的代码:
步骤 1: 使用 Vue 引用来访问 DOM 元素
首先,使用 Vue 的 ref 来创建一个引用,而不是使用 document.getElementById。你已经为 div 元素创建了一个引用 echartsDom:
<div ref="echartsDom" style="width: 600px; height: 400px;"></div>
步骤 2: 在合适的生命周期钩子中初始化 ECharts
由于直接在 <script setup> 中执行代码可能会在 DOM 元素准备好之前尝试访问它们,因此你需要确保在 DOM 元素可用时初始化 ECharts 实例。在 Vue 3 中,你可以使用 onMounted 钩子来保证 DOM 已经挂载:
import { onMounted, ref } from 'vue';

const echartsDom = ref(null); // 创建一个 ref

onMounted(() => {
    if (echartsDom.value) {
        var myChart = echarts.init(echartsDom.value);
        // 指定图表的配置项和数据
        var option = {
            // 配置项...
        };
        // 使用刚指定的配置项和数据显示图表。
        myChart.setOption(option);
    }
});
注意:在使用组合式 API 时,通过 ref 创建的引用在模板中使用时不需要 .value,但在 JavaScript 中访问时,需要通过 .value 来获取其真实的 DOM 元素。
完整的修改建议
根据上述步骤修改后,你的 <script setup> 部分应该类似于这样:
import { onMounted, ref } from 'vue';
import * as echarts from 'echarts';
// 其他 import...
const echartsDom = ref(null);
onMounted(() => {
if (echartsDom.value) {
var myChart = echarts.init(echartsDom.value);
var option = {
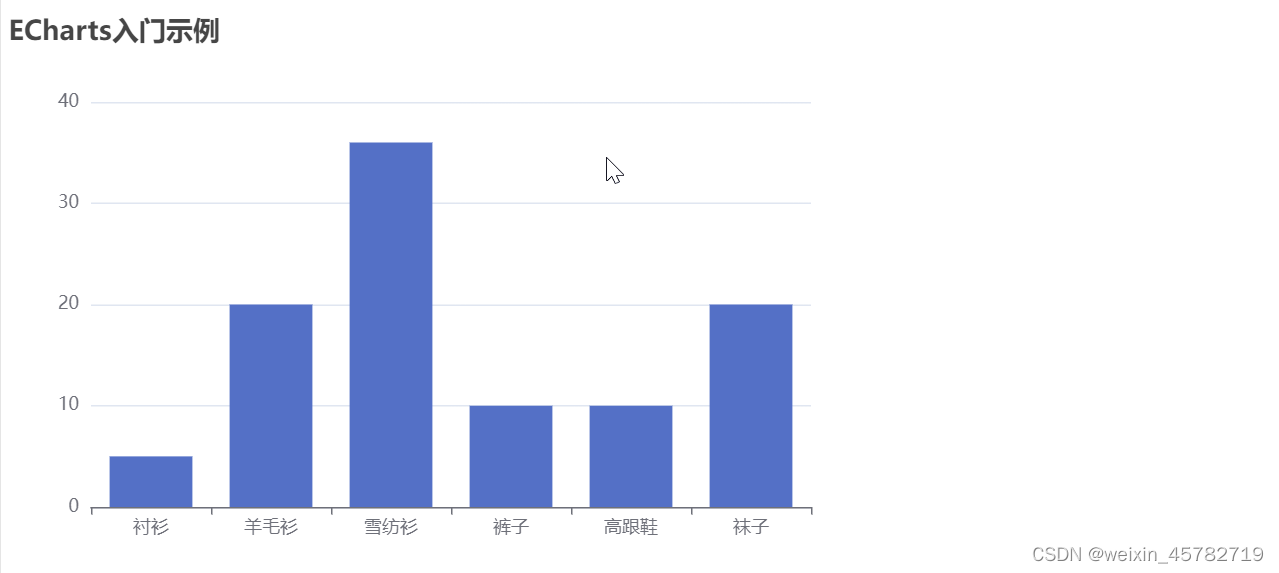
title: {
text: 'ECharts入门示例'
},
tooltip: {},
xAxis: {
data: ["衬衫","羊毛衫","雪纺衫","裤子","高跟鞋","袜子"]
},
yAxis: {},
series: [{
name: '销量',
type: 'bar',
data: [5, 20, 36, 10, 10, 20]
}]
};
myChart.setOption(option);
}
});
并在 template 部分相应地更新 echartsDom ref 的使用:
<div ref="echartsDom" style="width: 600px; height: 400px;"></div>
执行效果:
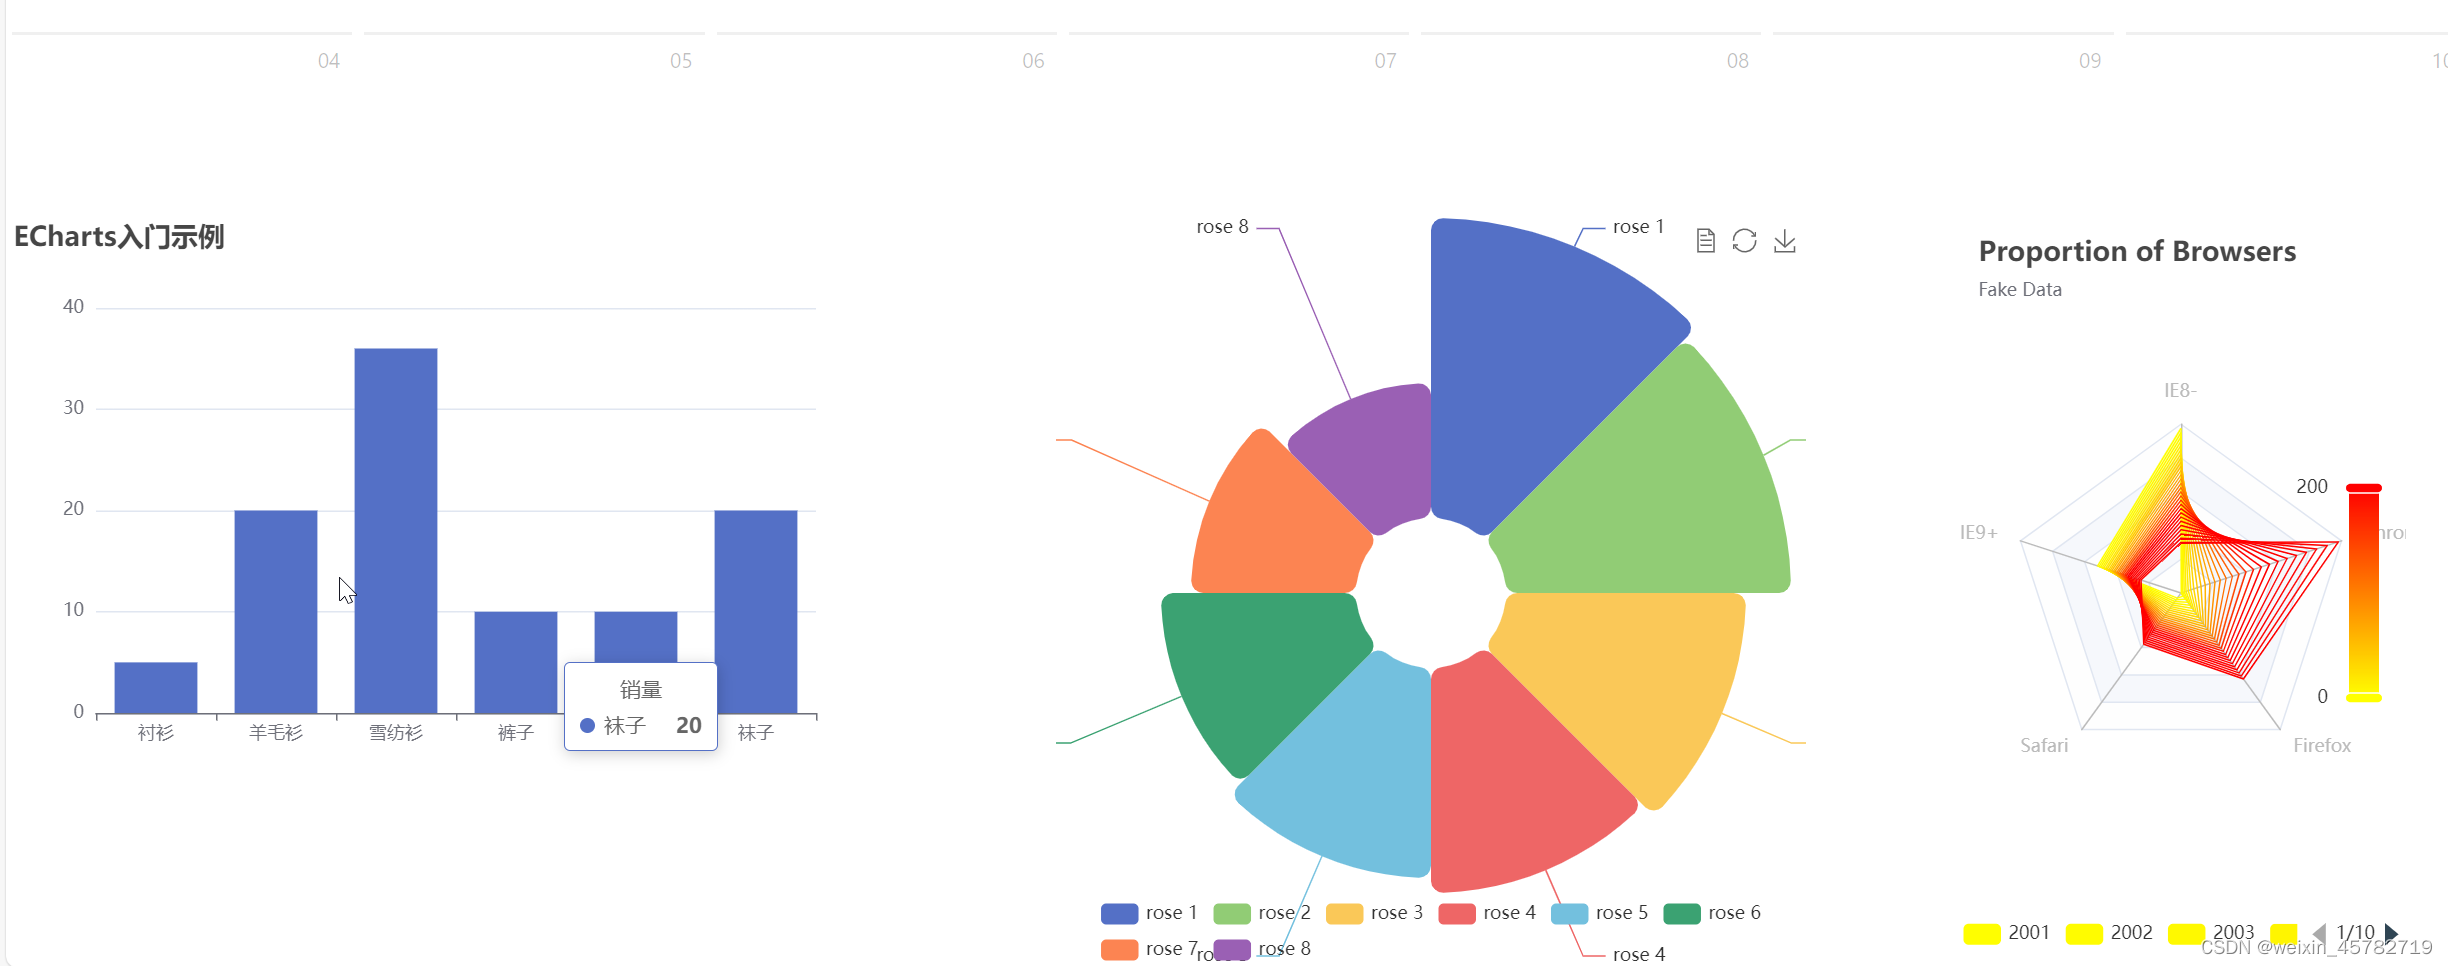
例子2
  <template>

    <h1 class="time">Time</h1>
    <div>
      <div class="c1">
        <ConfigProvider :locale="zhCN">
          <!-- 应用的其他内容 -->
          <div>
            <a-button type="primary" @click="showModal">Open Modal</a-button>
            <a-modal v-model:open="open" title="Basic Modal" @ok="handleOk">
              <a-form
                  :model="formState"
                  name="basic"
                  :label-col="{ span: 8 }"
                  :wrapper-col="{ span: 16 }"
                  autocomplete="off"
                  @finish="onFinish"
                  @finishFailed="onFinishFailed"
              >
                <a-form-item
                    label="Username"
                    name="username"
                    :rules="[{ required: true, message: 'Please input your username!' }]"
                >
                  <a-input v-model:value="formState.username" />
                </a-form-item>

                <a-form-item
                    label="Password"
                    name="password"
                    :rules="[{ required: true, message: 'Please input your password!' }]"
                >
                  <a-input-password v-model:value="formState.password" />
                </a-form-item>

                <a-form-item name="remember" :wrapper-col="{ offset: 8, span: 16 }">
                  <a-checkbox v-model:checked="formState.remember">Remember me</a-checkbox>
                </a-form-item>

                <a-form-item :wrapper-col="{ offset: 8, span: 16 }">
                  <a-button type="primary" html-type="submit">Submit</a-button>
                </a-form-item>
              </a-form>
            </a-modal>
          </div>
          <a-calendar v-model:value="value" @panelChange="onPanelChange" @select="onSelect"></a-calendar>
          <router-view/>
        </ConfigProvider>
      </div>
      <div class="c2">
        <div ref="echartsDom" style="width: 600px; height: 400px;"></div>
      </div>
      <div class="c3">
        <div class="chart" ref="chart"></div>
      </div>
      <div class="c4" >
       <!-- 在HTML中指定一个容器,用来容纳将要绘制的图表 -->
        <div class="drak" ref="dark"></div>
      </div>
    </div>
  </template>


  <script setup>
  import * as echarts from 'echarts';
  import { ConfigProvider } from 'ant-design-vue';
  import zhCN from 'ant-design-vue/es/locale/zh_CN';
  import {onMounted, ref} from 'vue';
  const open = ref(false);
  const showModal = () => {
    open.value = true;
  };
  const handleOk = e => {
    console.log(e);
    open.value = false;
  };

  import { reactive } from 'vue';
  const formState = reactive({
    username: '',
    password: '',
    remember: true,
  });
  const onFinish = values => {
    console.log('Success:', values);
  };
  const onFinishFailed = errorInfo => {
    console.log('Failed:', errorInfo);
  };

  const value = ref();
  const onPanelChange = (value, mode) => {
    console.log(value, mode);
  };

  const echartsDom = ref(null);

  /*饼图*/
  const chart = ref(null)
  let setbing = () =>{
  //基于准备好的dom,初始化echarts实例
    const myChart1 = echarts.init(chart.value);
    var option1;
    option1 = {
      legend: {
        top: 'bottom'
      },
      toolbox: {
        show: true,
        feature: {
          mark: { show: true },
          dataView: { show: true, readOnly: false },
          restore: { show: true },
          saveAsImage: { show: true }
        }
      },
      series: [
        {
          name: 'Nightingale Chart',
          type: 'pie',
          radius: [50, 250],
          center: ['50%', '50%'],
          roseType: 'area',
          itemStyle: {
            borderRadius: 8
          },
          data: [
            { value: 40, name: 'rose 1' },
            { value: 38, name: 'rose 2' },
            { value: 32, name: 'rose 3' },
            { value: 30, name: 'rose 4' },
            { value: 28, name: 'rose 5' },
            { value: 26, name: 'rose 6' },
            { value: 22, name: 'rose 7' },
            { value: 18, name: 'rose 8' }
          ]
        }
      ]
    };
    //使用刚指定的配置项和数据显示图表。
    option1 && myChart1.setOption(option1);
  }

  /*3d图*/
  const dark = ref()
  let ditu = () =>{
    var myChart2 = echarts.init(dark.value);
    var option2;
    option2 = {
      title: {
        text: 'Proportion of Browsers',
        subtext: 'Fake Data',
        top: 10,
        left: 10
      },
      tooltip: {
        trigger: 'item'
      },
      legend: {
        type: 'scroll',
        bottom: 10,
        data: (function () {
          var list = [];
          for (var i = 1; i <= 28; i++) {
            list.push(i + 2000 + '');
          }
          return list;
        })()
      },
      visualMap: {
        top: 'middle',
        right: 10,
        color: ['red', 'yellow'],
        calculable: true
      },
      radar: {
        indicator: [
          { text: 'IE8-', max: 400 },
          { text: 'IE9+', max: 400 },
          { text: 'Safari', max: 400 },
          { text: 'Firefox', max: 400 },
          { text: 'Chrome', max: 400 }
        ]
      },
      series: (function () {
        var series = [];
        for (var i = 1; i <= 28; i++) {
          series.push({
            type: 'radar',
            symbol: 'none',
            lineStyle: {
              width: 1
            },
            emphasis: {
              areaStyle: {
                color: 'rgba(0,250,0,0.3)'
              }
            },
            data: [
              {
                value: [
                  (40 - i) * 10,
                  (38 - i) * 4 + 60,
                  i * 5 + 10,
                  i * 9,
                  (i * i) / 2
                ],
                name: i + 2000 + ''
              }
            ]
          });
        }
        return series;
      })()
    };
    option2 && myChart2.setOption(option2);
  }


  onMounted(() => {
    if (echartsDom.value) {
      var myChart = echarts.init(echartsDom.value);
      var option = {
        title: {
          text: 'ECharts入门示例'
        },
        tooltip: {},
        xAxis: {
          data: ["衬衫","羊毛衫","雪纺衫","裤子","高跟鞋","袜子"]
        },
        yAxis: {},
        series: [{
          name: '销量',
          type: 'bar',
          data: [5, 20, 36, 10, 10, 20]
        }]
      };
      myChart.setOption(option);
    }
    setbing()
    ditu()
  });

  </script>

  <style scoped>
  .events {
    list-style: none;
    margin: 0;
    padding: 0;
  }
  .events .ant-badge-status {
    overflow: hidden;
    white-space: nowrap;
    width: 100%;
    text-overflow: ellipsis;
    font-size: 12px;
  }
  .notes-month {
    text-align: center;
    font-size: 28px;
  }
  .notes-month section {
    font-size: 28px;
  }
   .chart{
     width: 500px;
     height: 500px;
     float: left;
     margin: 0 auto 0 100px;
   }
   .c1,.c2,.c3,.c4  {
     float: left;
   }
  .drak{
    width: 300px;
    height: 500px;
    float: left;
    margin: 0 auto 0 100px;
  }
  </style>
实现效果:


 2799
2799


 被折叠的 条评论
为什么被折叠?
被折叠的 条评论
为什么被折叠?
 到【灌水乐园】发言


