


学习目标:
提示:这里可以添加学习目标
例如:
- 入门vue3+d3
学习内容:
提示:这里可以添加要学的内容
1.安装Nodejs
下载并安装Nodejs,写一个新的文件 server.js,在命令行运行
node server.js。
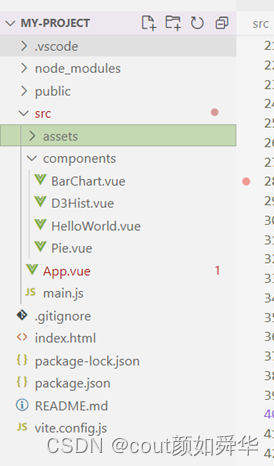
2 安装vue并在vscode里打开项目文件
npm install vue 安装vue
npm install vite 安装Vite 包
npm init vite-app my-project 创建工程
npm run dev 运行
3.vue 基本用法文档结构
使用Npm run my-project 运行项目
4.导入d3
npm run d3
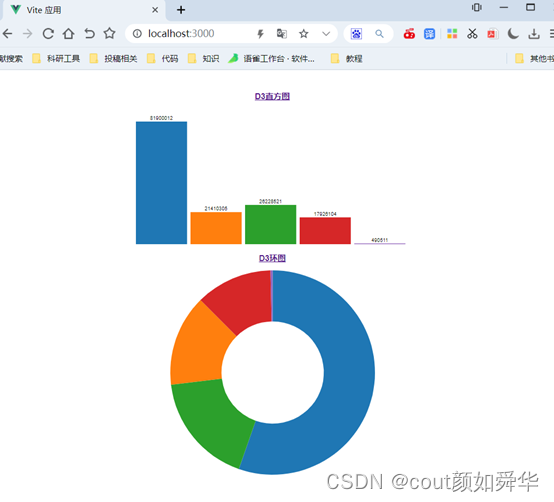
5.使用d3进行基本数据可视化
这是其中的一部分,画直方图。
<script>
import { defineComponent } from 'vue';
import * as d3 from "d3";
var confirm=[81900012,21410305,26228521,17926104,490511];
var color=d3.schemeCategory10;
var area=["美国","英国","法国","俄罗斯","中国"];
export default defineComponent({
    mounted(){
        this.drawBarChart(data);
    },
    methods:{
        drawBarChart(data){
            const width=800;
            const height=400;
            var scale=81900012/(height*0.9);
            var rectStep =width/confirm.length;
		    var rectWidth =rectStep-10;
            var svg=d3.select("#bar-chart-container")
                         .append("svg")
                        .attr("width",width)
                        .attr("height",height);
            // var svg2= d3.select("#bar-chart-container")
		  	// 				.append("svg")
		  	// 				.attr("width", width)
		  	// 				.attr("height", height*0.1);
            svg.selectAll("rect")
                .data(confirm)
                .enter()
                .append("rect")
                .attr("fill",(d,i)=>color[i])
                .attr("x",function(d,i){
                    return  i * rectStep;
                })
                .attr("y",d=>(height-d/scale))
                .attr("height",d=>(d/scale))
                .attr("width",rectWidth);
            svg.selectAll("text")
		  					.data(confirm)
		  					.enter()
		  					.append("text")
		  					.attr("fill","black")
		  					.attr("font-size","15px")
		  					.attr("text-anchor","middle")
		  					.attr("x", function(d,i){
		  						return i * rectStep;
		  					})
		  					.attr("y", function(d){
		  						return height-d/scale-20;
		  					})
		  					.attr("dx",rectWidth/2)
		  					.attr("dy","1em")
		  					.text(function(d){
		  						console.log(d);
		  						return Math.floor(d);
		  					});
            // svg2.selectAll("text")
		  	// 					.data(area)
		  	// 					.enter()
		  	// 					.append("text")
		  	// 					.attr("fill","black")
		  	// 					.attr("font-size","15px")
		  	// 					.attr("text-anchor","middle")
		  	// 					.attr("x", function(d,i){
		  	// 						console.log(i);
		  	// 						return i * rectStep;
		  	// 					})
		  	// 					.attr("y", 0)
		  	// 					.attr("dx",rectWidth)
		  	// 					.attr("dy","1em")
		  	// 					.text(function(d){
		  	// 						console.log(d);
		  	// 						return d;
		  	// 					});

        }
    }
})
</script>
结果展示:


 7349
7349


 被折叠的 条评论
为什么被折叠?
被折叠的 条评论
为什么被折叠?
 到【灌水乐园】发言


