


Filebeat
1. Filebeat介绍
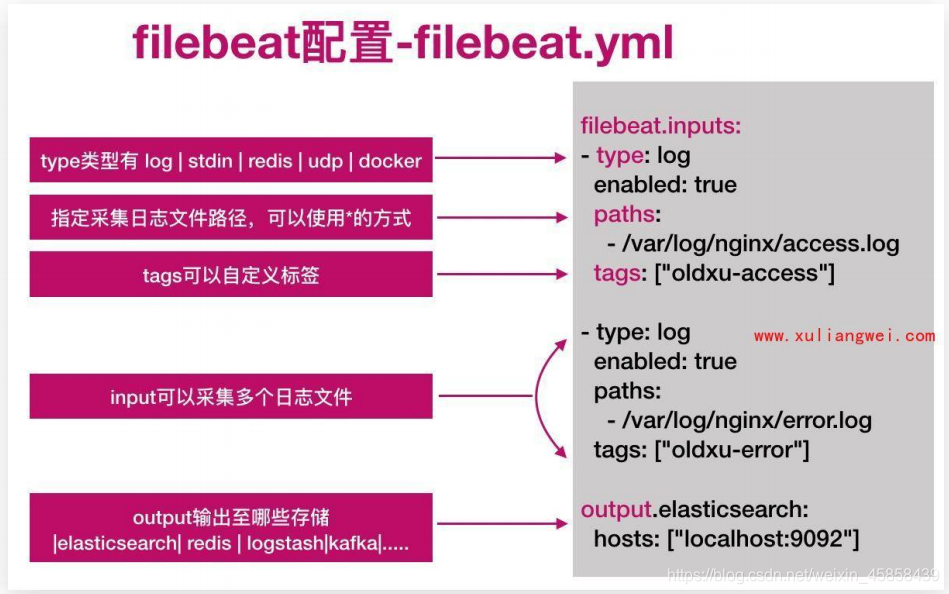
fliebeat用于“转发”和“集中日志数据”的“轻量型数据采集器”。Fliebeat监视您指定的日志文件路径,收集日志事件并将数据转发到Elasticsearch或Logstash|Redis|Kafka等。

input 我们要采集的日志文件路径, 收割机 harvester 监听文件的变化 -->
splooer程序 --> 转发 es | logstash | kafka | redis

1.1 Fliebeat主要组件
Filebeat包含两个主要组件:输入和收割机,这些组件协同工作将文件尾部最新事件数据发送到指定的输出
1.输入(input):输入负责管理收割机从哪个路径查找所有可读取的资源。
2.收割机(Harvester):负责逐行读取单个文件的内容,然后将内容发送到输出。
1.2 Fliebeat工作流程
当Filebeat启动后,Filebeat通过input读取指定的日志路径,然后为该日志启动一个收割进程(harvester),每一个收割进程读取一个日志文件的新内容,并发送这些新的日志数据到处理程序(spooler),处理程序会集合这些事件,最后Filebeat会发送集合的数据到你指定的地点。
官方链接:https://www.elastic.co/guide/en/beats/filebeat/current/filebeat-overview.html

1.3 Filebeat配置
2.Filebeat使用
2.1 安装filebeat
#1.安装(此处我们安装在web01:10.0.0.6机器中)
[root@web01 ~]# rpm -ivh filebeat-7.4.0-x86_64.rpm
[root@web01 ~]# cd /etc/filebeat/
[root@web01 filebeat]# ls
fields.yml  filebeat.reference.yml  filebeat.yml  modules.d
#2.启动
[root@web01 filebeat]# systemctl enable filebeat
[root@web01 filebeat]# systemctl start filebeat

#3.写一个测试用例
[root@web01 filebeat]# cat test.yml
#读入
filebeat.inputs:
  - type: stdin #标准输入
    enabled: true #启用

#输出
output.console: #标准输出
  pretty: true
  enable: true

#4.启动测试用例
[root@web01 filebeat]# filebeat -e -c test.yml
2021-06-08T20:15:28.703+0800	INFO	crawler/crawler.go:72	Loading Inputs: 1
2021-06-08T20:15:28.704+0800	INFO	input/input.go:114	Starting input of type: stdin; ID: 11136643476161899408
2021-06-08T20:15:28.704+0800	INFO	crawler/crawler.go:106	Loading and starting Inputs completed. Enabled inputs: 1
2021-06-08T20:15:28.704+0800	INFO	[monitoring]	log/log.go:118	Starting metrics logging every 30s
2021-06-08T20:15:28.704+0800	INFO	log/harvester.go:251	Harvester started for file: -
#上面这种情况就是启动成功
#输入123,如下图

2.2 配置filebeat从文件中读取数据
[root@web01 filebeat]# cat file.yml
filebeat.inputs:
- type: log
  enabled: true
  paths:
    - /var/log/nginx/access.log

output.console:
  pretty: true
  enable: true

#启动file.yml
[root@web01 filebeat]# filebeat -e -c file.yml
2021-06-08T20:28:02.697+0800	INFO	[monitoring]	log/log.go:118	Starting metrics logging every 30s
2021-06-08T20:28:02.697+0800	INFO	log/harvester.go:251	Harvester started for file: /var/log/nginx/access.log
#Harvester started for file: /var/log/nginx/access.log:监控的/var/log/nginx/access.log文件

2.3 配置filebeat从nginx读取数据写入elasticsearch
[root@web01 filebeat]# cat es.yml
filebeat.inputs:
- type: log
  enabled: true
  paths:
    - /var/log/nginx/access.log

output.elasticsearch:
  hosts: ["10.0.0.161:9200","10.0.0.162:9200","10.0.0.163:9200"]
  index: access-nginx-log  #给索引应该加个时间,否则都往一个索引打日志,会造成索引很大

#启动es.yml
[root@web01 filebeat]# filebeat -e -c es.yml
2021-06-08T20:58:26.020+0800	INFO	instance/beat.go:607	Home path: [/usr/share/filebeat] Config path: [/etc/filebeat] Data path: [/var/lib/filebeat] Logs path: [/var/log/filebeat]
2021-06-08T20:58:26.020+0800	INFO	instance/beat.go:615	Beat ID: c2e57138-56c0-4c2f-9cfc-416d8213b66a
2021-06-08T20:58:26.020+0800	INFO	[seccomp]	seccomp/seccomp.go:124	Syscall filter successfully installed
2021-06-08T20:58:26.020+0800	INFO	[beat]	instance/beat.go:903	Beat info	{"system_info": {"beat": {"path": {"config": "/etc/filebeat", "data": "/var/lib/filebeat", "home": "/usr/share/filebeat", "logs": "/var/log/filebeat"}, "type": "filebeat", "uuid": "c2e57138-56c0-4c2f-9cfc-416d8213b66a"}}}
2021-06-08T20:58:26.021+0800	INFO	[beat]	instance/beat.go:912	Build info	{"system_info": {"build": {"commit": "f940c36884d3749901a9c99bea5463a6030cdd9c", "libbeat": "7.4.0", "time": "2019-09-27T07:45:44.000Z", "version": "7.4.0"}}}
2021-06-08T20:58:26.021+0800	INFO	[beat]	instance/beat.go:915	Go runtime info	{"system_info": {"go": {"os":"linux","arch":"amd64","max_procs":1,"version":"go1.12.9"}}}
2021-06-08T20:58:26.022+0800	INFO	[beat]	instance/beat.go:919	Host info	{"system_info": {"host": {"architecture":"x86_64","boot_time":"2021-06-08T20:02:27+08:00","containerized":false,"name":"web01","ip":["127.0.0.1/8","::1/128","10.0.0.6/24","fe80::205e:d53b:4d4d:e157/64"],"kernel_version":"3.10.0-957.el7.x86_64","mac":["00:0c:29:c0:e2:40"],"os":{"family":"redhat","platform":"centos","name":"CentOS Linux","version":"7 (Core)","major":7,"minor":6,"patch":1810,"codename":"Core"},"timezone":"CST","timezone_offset_sec":28800,"id":"fdcd4e647bbe43369726c5444d1df858"}}}
2021-06-08T20:58:26.023+0800	INFO	[beat]	instance/beat.go:948	Process info	{"system_info": {"process": {"capabilities": {"inheritable":null,"permitted":["chown","dac_override","dac_read_search","fowner","fsetid","kill","setgid","setuid","setpcap","linux_immutable","net_bind_service","net_broadcast","net_admin","net_raw","ipc_lock","ipc_owner","sys_module","sys_rawio","sys_chroot","sys_ptrace","sys_pacct","sys_admin","sys_boot","sys_nice","sys_resource","sys_time","sys_tty_config","mknod","lease","audit_write","audit_control","setfcap","mac_override","mac_admin","syslog","wake_alarm","block_suspend"],"effective":["chown","dac_override","dac_read_search","fowner","fsetid","kill","setgid","setuid","setpcap","linux_immutable","net_bind_service","net_broadcast","net_admin","net_raw","ipc_lock","ipc_owner","sys_module","sys_rawio","sys_chroot","sys_ptrace","sys_pacct","sys_admin","sys_boot","sys_nice","sys_resource","sys_time","sys_tty_config","mknod","lease","audit_write","audit_control","setfcap","mac_override","mac_admin","syslog","wake_alarm","block_suspend"],"bounding":["chown","dac_override","dac_read_search","fowner","fsetid","kill","setgid","setuid","setpcap","linux_immutable","net_bind_service","net_broadcast","net_admin","net_raw","ipc_lock","ipc_owner","sys_module","sys_rawio","sys_chroot","sys_ptrace","sys_pacct","sys_admin","sys_boot","sys_nice","sys_resource","sys_time","sys_tty_config","mknod","lease","audit_write","audit_control","setfcap","mac_override","mac_admin","syslog","wake_alarm","block_suspend"],"ambient":null}, "cwd": "/etc/filebeat", "exe": "/usr/share/filebeat/bin/filebeat", "name": "filebeat", "pid": 7446, "ppid": 7252, "seccomp": {"mode":"filter"}, "start_time": "2021-06-08T20:58:25.290+0800"}}}
2021-06-08T20:58:26.023+0800	INFO	instance/beat.go:292	Setup Beat: filebeat; Version: 7.4.0
2021-06-08T20:58:26.023+0800	INFO	[index-management]	idxmgmt/std.go:178	Set output.elasticsearch.index to 'filebeat-7.4.0' as ILM is enabled.
2021-06-08T20:58:26.023+0800	INFO	elasticsearch/client.go:170	Elasticsearch url: http://10.0.0.161:9200
2021-06-08T20:58:26.024+0800	INFO	elasticsearch/client.go:170	Elasticsearch url: http://10.0.0.162:9200
2021-06-08T20:58:26.024+0800	INFO	elasticsearch/client.go:170	Elasticsearch url: http://10.0.0.163:9200
2021-06-08T20:58:26.025+0800	INFO	[publisher]	pipeline/module.go:97	Beat name: web01
2021-06-08T20:58:26.027+0800	INFO	instance/beat.go:422	filebeat start running.
2021-06-08T20:58:26.027+0800	INFO	registrar/registrar.go:145	Loading registrar data from /var/lib/filebeat/registry/filebeat/data.json
2021-06-08T20:58:26.027+0800	INFO	registrar/registrar.go:152	States Loaded from registrar: 2
2021-06-08T20:58:26.027+0800	INFO	crawler/crawler.go:72	Loading Inputs: 1
2021-06-08T20:58:26.031+0800	INFO	[monitoring]	log/log.go:118	Starting metrics logging every 30s
2021-06-08T20:58:26.032+0800	INFO	log/input.go:152	Configured paths: [/var/log/nginx/access.log]
2021-06-08T20:58:26.032+0800	INFO	input/input.go:114	Starting input of type: log; ID: 4059289650930770670
2021-06-08T20:58:26.032+0800	INFO	crawler/crawler.go:106	Loading and starting Inputs completed. Enabled inputs: 1
2021-06-08T20:58:46.037+0800	INFO	log/harvester.go:251	Harvester started for file: /var/log/nginx/access.log
2021-06-08T20:58:47.041+0800	INFO	pipeline/output.go:95	Connecting to backoff(elasticsearch(http://10.0.0.163:9200))
2021-06-08T20:58:47.042+0800	INFO	pipeline/output.go:95	Connecting to backoff(elasticsearch(http://10.0.0.161:9200))
2021-06-08T20:58:47.043+0800	INFO	pipeline/output.go:95	Connecting to backoff(elasticsearch(http://10.0.0.162:9200))
2021-06-08T20:58:47.309+0800	INFO	elasticsearch/client.go:743	Attempting to connect to Elasticsearch version 7.4.0
2021-06-08T20:58:47.430+0800	INFO	[index-management]	idxmgmt/std.go:252	Auto ILM enable success.
2021-06-08T20:58:52.475+0800	INFO	[index-management]	idxmgmt/std.go:265	ILM policy successfully loaded.
2021-06-08T20:58:52.475+0800	INFO	[index-management]	idxmgmt/std.go:394	Set setup.template.name to '{filebeat-7.4.0 {now/d}-000001}' as ILM is enabled.
2021-06-08T20:58:52.476+0800	INFO	[index-management]	idxmgmt/std.go:399	Set setup.template.pattern to 'filebeat-7.4.0-*' as ILM is enabled.
2021-06-08T20:58:52.476+0800	INFO	[index-management]	idxmgmt/std.go:433	Set settings.index.lifecycle.rollover_alias in template to {filebeat-7.4.0 {now/d}-000001} as ILM is enabled.
2021-06-08T20:58:52.476+0800	INFO	[index-management]	idxmgmt/std.go:437	Set settings.index.lifecycle.name in template to {filebeat-7.4.0 {"policy":{"phases":{"hot":{"actions":{"rollover":{"max_age":"30d","max_size":"50gb"}}}}}}} as ILM is enabled.

想看刚才es.yml中写入elasticsearch,在kibana中看

3.收集系统日志
3.1系统日志一般指的哪些?
系统日志其实很宽泛,通常我们说的是messages、secure、cron、dmesg、ssh、boot等日志。
3.2系统日志如何统一规范收集?
系统中有很多日志,挨个配置收集就变的非常麻烦,所以我们需要对这些日志进行统一的管理。
可以通过rsyslog将本地所有类型的日志都写入/var/log/rizhi.log文件中,如何使用filebeat对该文件进行收集即可。
3.3收集系统日志架构图
rsyslog+filebeat------> elasticsearch集群<------kibana展示

3.4系统日志收集实战
#0.环境准备
配置rsyslog和filebeat

#1.安装rsyslog
[root@web01 ~]# yum install rsyslog -y
#2.配置rsyslog

# Provides UDP syslog reception  #udp协议
#$ModLoad imudp
#$UDPServerRun 514

#配置收集日志的方式
#*.* @IP:514            #将本地所有的日志通过网络发送给远程服务器
*.* /var/log/rizhi.log  #将本地所有的日志保存至本地/var/log/rizhi.log

#3.重启rsyslog,然后测试
[root@web01 ~]# systemctl restart rsyslog
[root@web01 ~]# tail -f /var/log/rizhi.log
Jun  8 22:25:18 web01 systemd: Stopping System Logging Service...
Jun  8 22:25:18 web01 rsyslogd: [origin software="rsyslogd" swVersion="8.24.0-57.el7_9" x-pid="7603" x-info="http://www.rsyslog.com"] exiting on signal 15.
Jun  8 22:25:18 web01 systemd: Stopped System Logging Service.
Jun  8 22:25:18 web01 systemd: Starting System Logging Service...
Jun  8 22:25:19 web01 rsyslogd: [origin software="rsyslogd" swVersion="8.24.0-57.el7_9" x-pid="7618" x-info="http://www.rsyslog.com"] start
Jun  8 22:25:19 web01 polkitd[6037]: Unregistered Authentication Agent for unix-process:7612:857094 (system bus name :1.27, object path /org/freedesktop/PolicyKit1/AuthenticationAgent, locale en_US.UTF-8) (disconnected from bus)
Jun  8 22:25:19 web01 systemd: Started System Logging Service.
Jun  8 22:25:32 web01 filebeat: 2021-06-08T22:25:32.571+0800#011INFO#011[monitoring]#011log/log.go:145#011Non-zero metrics in the last 30s#011{"monitoring": {"metrics": {"beat":{"cpu":{"system":{"ticks":920,"time":{"ms":2}},"total":{"ticks":2440,"time":{"ms":7},"value":2440},"user":{"ticks":1520,"time":{"ms":5}}},"handles":{"limit":{"hard":4096,"soft":1024},"open":5},"info":{"ephemeral_id":"545d2bf0-b80a-4634-b7e0-4089588547e7","uptime":{"ms":7860098}},"memstats":{"gc_next":7031424,"memory_alloc":4376736,"memory_total":84048896},"runtime":{"goroutines":15}},"filebeat":{"harvester":{"open_files":0,"running":0}},"libbeat":{"config":{"module":{"running":0}},"pipeline":{"clients":0,"events":{"active":0}}},"registrar":{"states":{"current":0}},"system":{"load":{"1":0.01,"15":0.05,"5":0.04,"norm":{"1":0.01,"15":0.05,"5":0.04}}}}}}
Jun  8 22:26:02 web01 filebeat: 2021-06-08T22:26:02.575+0800#011INFO#011[monitoring]#011log/log.go:145#011Non-zero metrics in the last 30s#011{"monitoring": {"metrics": {"beat":{"cpu":{"system":{"ticks":930,"time":{"ms":13}},"total":{"ticks":2480,"time":{"ms":35},"value":2480},"user":{"ticks":1550,"time":{"ms":22}}},"handles":{"limit":{"hard":4096,"soft":1024},"open":5},"info":{"ephemeral_id":"545d2bf0-b80a-4634-b7e0-4089588547e7","uptime":{"ms":7890110}},"memstats":{"gc_next":7031424,"memory_alloc":3521616,"memory_total":84329144},"runtime":{"goroutines":15}},"filebeat":{"harvester":{"open_files":0,"running":0}},"libbeat":{"config":{"module":{"running":0}},"pipeline":{"clients":0,"events":{"active":0}}},"registrar":{"states":{"current":0}},"system":{"load":{"1":0.01,"15":0.05,"5":0.04,"norm":{"1":0.01,"15":0.05,"5":0.04}}}}}}

#4.配置filebeat文件
[root@web01 ~]# cd /etc/filebeat/
[root@web01 filebeat]# cp filebeat.yml filebeat.yml.bak
[root@web01 filebeat]# cat filebeat.yml
filebeat.inputs:
- type: log
  enabled: true
  paths:
    - /var/log/rizhi.log

output.elasticsearch:
  hosts: ["10.0.0.161:9200","10.0.0.162:9200","10.0.0.163:9200"]
#没有指定索引,创建出来是默认索引
#5.重启filebeat
[root@web01 filebeat]# systemctl restart filebeat
#6.测试
重启完filebeat,然后在开启一个web01窗口,然后exit退出,查看日志tail -f /var/log/rizhi.log中看是否有日志,然后看elasticsearch中就新增加了一个索引,如下图:

然后用kibana的可视化模式查看
管理----->索引模式----->创建索引----->索引名称叫:filebeat*,然后会匹配一条
---->点下一步----->选@timestamp做为字段----->创建索引----->点击Discover----->点击filebeat*---->选择message


3.5修改filebeat配置,优化kibana展示数据
kibana展示的结果上有很多debug消息,其实该类消息无需收集,所以我们可以对收集的日志内容进行优化,只收集警告WARN、
错误ERR、sshd相关的日志。
#1.修改filebeat配置文件如下:
[root@web01 filebeat]# cat filebeat.yml
filebeat.inputs:
- type: log
  enabled: true
  paths:
    - /var/log/rizhi.log
  include_lines: ['^ERR', '^WARN','sshd']

output.elasticsearch:
  hosts: ["10.0.0.161:9200","10.0.0.162:9200","10.0.0.163:9200"]
  index: "system-%{[agent.version]}-%{+yyyy.MM.dd}"

setup.ilm.enabled: false
setup.template.name: system #搜索关联的模板名称
setup.template.pattern: system-*
#没有指定索引,创建出来是默认索引

#2.删除elasticsearch中的索引以及kibana中创建的索引
#3.重启filebeat
[root@web01 filebeat]# systemctl restart filebeat
#重启之后在开启一个web01窗口
#elasticsearch中又出来一个filebeat的索引,然后kibana中和上个步骤一样,创建一个索引

如上图所示,有登录web01和退出web01日志信息
4.收集nginx日志
4.1 为什么要收集nginx日志?
我们需要获取用户的信息,比如:来源的IP是那个地域,网站的PV、UV、状态码、访问时间等等信息。
4.2 收集nginx日志架构图

4.3nginx日志快速收集
#1.先配置一个nginx的文件
[root@web01 ~]# cat /etc/nginx/conf.d/elk.test.conf
server {
   listen 80;
   server_name elk.test.com;
   root /code;

   location / {
       index index.html;
   }
}

[root@web01 ~]# systemctl restart nginx
#测试一下看打日志是否正常
[root@web01 ~]# curl -H Host:elk.test.com http://10.0.0.6
elk....web01
[root@web01 ~]# tail -f /var/log/nginx/access.log
10.0.0.6 - - [15/Jun/2021:22:18:16 +0800] "GET / HTTP/1.1" 200 13 "-" "curl/7.29.0" "-"

#2.配置filebeat
[root@web01 ~]# cat /etc/filebeat/filebeat.yml
filebeat.inputs:
- type: log
  enabled: true
  paths:
    - /var/log/nginx/access.log

output.elasticsearch:
  hosts: ["10.0.0.161:9200","10.0.0.162:9200","10.0.0.163:9200"]
  index: "nginx-%{[agent.version]}-%{+yyyy.MM.dd}"
#没有指定索引,创建出来是默认索引
setup.ilm.enabled: false
setup.template.name: nginx #搜索关联的模板名称
setup.template.pattern: nginx-*

#重启filebeat
[root@web01 ~]# systemctl restart filebeat

然后我们用kibana创建索引:
设置------管理------索引模式-------创建索引模式------索引模式(nginx)-----下一步------时间筛选字段(@timestamp)-------创建索引


然后我们在161、162、163机器中分别curl一下
[root@es001 ~]# curl -H Host:elk.test.com http://10.0.0.6
elk....web01
[root@es002 ~]# curl -H Host:elk.test.com http://10.0.0.6
elk....web01
[root@es003 ~]# curl -H Host:elk.test.com http://10.0.0.6
elk....web01

到此,nginx日志收集完毕,如果多台nginx,只需要把filebeat.yml复制过去即可。
4.4 nginx JSON日志收集
4.4.1 问题现象?
如上实现了日志收集,但是所有的数据都在message字段中,无法满足分析的需求。比如我们想统计状态码,但是会发现没有办法过滤数据。
4.4.2 解决方案?
需要将日志中的一个选项都拆分出来,拆分成key-value的形式,那么就需要json的格式。
基本写法: 张三 男 20
json写法:姓名:张三 性别:男 年龄:20
当我们需要筛选姓名时,json的写法会将所有姓名对应的值都会被列出来,便于后续的统计与分析。
4.4.3 如何将nginx日志格式转换成json格式?
#配置nginx.conf文件
[root@web01 ~]# vim /etc/nginx/nginx.conf
.......#放在log_format下
log_format json '{ "time_local": "$time_local", '
 '"remote_addr": "$remote_addr", '
 '"referer": "$http_referer",'
 '"request": "$request", '
 '"status": $status, '
 '"bytes": $body_bytes_sent, '
 '"agent": "$http_user_agent",'
 '"x_forwarded": "$http_x_forwarded_for", '
 '"up_addr": "$upstream_addr",'
 '"up_host": "$upstream_http_host",'
 '"upstream_time": "$upstream_response_time",'
 '"request_time": "$request_time"'
 '}';

 access_log /var/log/nginx/access.log json;

#先清空原来的日志,因为不是json格式的
[root@web01 ~]# >/var/log/nginx/access.log
#重启一下nginx和filebeat
[root@web01 ~]# systemctl restart nginx filebeat
#删除nginx索引和kibana中前面创建的索引


#访问一下
[root@es001 ~]# curl -H Host:elk.test.com http://10.0.0.6
elk....web01

[root@web01 ~]# tail -f /var/log/nginx/access.log
[root@web01 ~]# cat /var/log/nginx/access.log
{ "time_local": "17/Jun/2021:21:40:06 +0800", "remote_addr": "10.0.0.161", "referer": "-","request": "GET / HTTP/1.1", "status": 200, "bytes": 13, "agent": "curl/7.29.0","x_forwarded": "-", "up_addr": "-","up_host": "-","upstream_time": "-","request_time": "0.000"}


#修改filebeat.yml
[root@web01 ~]# cat /etc/filebeat/filebeat.yml
filebeat.inputs:
- type: log
  enabled: true
  paths:
    - /var/log/nginx/access.log

  json.keys_under_root: true #默认false,还会将json解析的日志存储至messages字段
  json.overwrite_keys: true #覆盖默认的key,使用自定义json格式的key

output.elasticsearch:
  hosts: ["10.0.0.161:9200","10.0.0.162:9200","10.0.0.163:9200"]
  index: "nginx-%{[agent.version]}-%{+yyyy.MM.dd}"
#没有指定索引,创建出来是默认索引
setup.ilm.enabled: false
setup.template.name: nginx #搜索关联的模板名称
setup.template.pattern: nginx-*
可以校验一下是否为json格式


有nginx的索引了
如何创建索引,和前面相同,也是nginx*


创建一个可视化分析


###我们讲日志中造出一些304 404 500状态码看看效果

4.4.4 错误日志
nginx存在访问日志和错误日志,那么如何使用filebeat同时收集nginx的访问日志,错误日志。我们希望的状态如下:
nginx访问日志-----存储----->nginx-access-7.4.0—2021.06-19 索引
nginx错误日志-----存储----->nginx-error-7.4.0—2021.06-19 索引

#编辑tag.yml,因为打访问日志和错误日志,需要区分不同的索引
[root@web01 filebeat]# cat filebeat.yml
filebeat.inputs:
- type: log
  enabled: true
  paths:
    - /var/log/nginx/access.log

  json.keys_under_root: true #默认false,还会将json解析的日志存储至messages字段
  json.overwrite_keys: true #覆盖默认的key,使用自定义json格式的key
  tags: ["access"]

- type: log
  enabled: true
  paths:
    - /var/log/nginx/error.log
  tags: ["error"]


output.elasticsearch:
  hosts: ["10.0.0.161:9200","10.0.0.162:9200","10.0.0.163:9200"]
  indices:
    - index: "nginx-access-%{[agent.version]}-%{+yyyy.MM.dd}"
      when.contains:  #加了一个判断,判断tag
        tags: "access"

    - index: "nginx-error-%{[agent.version]}-%{+yyyy.MM.dd}"
      when.contains:
        tags: "error"

setup.ilm.enabled: false
setup.template.name: nginx #搜索关联的模板名称
setup.template.pattern: nginx-*

#测试文件是否正确
[root@web01 filebeat]# filebeat -e -c filebeat.yml

#将nginx-access的索引先删除
#重启filebeat和nginx
[root@web01 filebeat]# systemctl restart nginx filebeat

#在161、162、163中在curl下
[root@es001 ~]# curl -H Host:elk.test.com http://10.0.0.6
elk....web01
[root@es002 ~]# curl -H Host:elk.test.com http://10.0.0.6
elk....web01
[root@es003 ~]# curl -H Host:elk.test.com http://10.0.0.6
elk....web01


[root@es002 ~]# curl -H Host:elk.test.com http://10.0.0.6/12344
<html>
<head><title>404 Not Found</title></head>
<body>
<center><h1>404 Not Found</h1></center>
<hr><center>nginx/1.20.1</center>
</body>
</html>

4.5 收集nginx多个虚拟主机的日志
#准备三个站点
elk.test.com

ttt.test.com

aaa.test.com

error日志


#1.配置多虚拟主机
[root@web01 conf.d]# cat elk.test.conf
server {
   listen 80;
   server_name elk.test.com;
   root /code/elk;
   access_log /var/log/nginx/elk.test.com.log json;

   location / {
       index index.html;
   }
}

[root@web01 conf.d]# cat aaa.test.conf
server {
   listen 80;
   server_name aaa.test.com;
   root /code/aaa;
   access_log /var/log/nginx/aaa.test.com.log json;

   location / {
       index index.html;
   }
}

[root@web01 conf.d]# cat ttt.test.conf
server {
   listen 80;
   server_name ttt.test.com;
   root /code/ttt;
   access_log /var/log/nginx/ttt.test.com.log json;

   location / {
       index index.html;
   }
}

[root@web01 conf.d]# mkdir -p /code/{elk,ttt,aaa}
[root@web01 conf.d]# echo "aaa" >/code/aaa/index.html
[root@web01 conf.d]# echo "ttt" >/code/ttt/index.html
[root@web01 conf.d]# echo "elk" >/code/elk/index.html
[root@web01 conf.d]# systemctl restart nginx

#2.curl一下测试一下,产生日志
[root@web01 conf.d]# curl -H Host:elk.test.com http://10.0.0.6
elk
[root@web01 conf.d]# curl -H Host:aaa.test.com http://10.0.0.6
aaa
[root@web01 conf.d]# curl -H Host:ttt.test.com http://10.0.0.6
ttt

#3.查看下日志
[root@web01 conf.d]# cat /var/log/nginx/elk.test.com.log
{ "time_local": "19/Jun/2021:15:26:55 +0800", "remote_addr": "10.0.0.6", "referer": "-","request": "GET / HTTP/1.1", "status": 200, "bytes": 4, "agent": "curl/7.29.0","x_forwarded": "-", "up_addr": "-","up_host": "-","upstream_time": "-","request_time": "0.000"}
[root@web01 conf.d]# cat /var/log/nginx/aaa.test.com.log
{ "time_local": "19/Jun/2021:15:27:01 +0800", "remote_addr": "10.0.0.6", "referer": "-","request": "GET / HTTP/1.1", "status": 200, "bytes": 4, "agent": "curl/7.29.0","x_forwarded": "-", "up_addr": "-","up_host": "-","upstream_time": "-","request_time": "0.000"}
[root@web01 conf.d]# cat /var/log/nginx/ttt.test.com.log
{ "time_local": "19/Jun/2021:15:27:05 +0800", "remote_addr": "10.0.0.6", "referer": "-","request": "GET / HTTP/1.1", "status": 200, "bytes": 4, "agent": "curl/7.29.0","x_forwarded": "-", "up_addr": "-","up_host": "-","upstream_time": "-","request_time": "0.000"}

#4.配置filebeat
[root@web01 filebeat]# cat filebeat.yml
filebeat.inputs:
- type: log
  enabled: true
  paths:
    - /var/log/nginx/elk.test.com.log
  json.keys_under_root: true #默认false,还会将json解析的日志存储至messages字段
  json.overwrite_keys: true #覆盖默认的key,使用自定义json格式的key
  tags: ["nginx-elk-host"]

- type: log
  enabled: true
  paths:
    - /var/log/nginx/aaa.test.com.log
  json.keys_under_root: true #默认false,还会将json解析的日志存储至messages字段
  json.overwrite_keys: true #覆盖默认的key,使用自定义json格式的key
  tags: ["nginx-aaa-host"]

- type: log
  enabled: true
  paths:
    - /var/log/nginx/ttt.test.com.log
  json.keys_under_root: true #默认false,还会将json解析的日志存储至messages字段
  json.overwrite_keys: true #覆盖默认的key,使用自定义json格式的key
  tags: ["nginx-ttt-host"]


- type: log
  enabled: true
  paths:
    - /var/log/nginx/error.log
  tags: ["nginx-error"]


output.elasticsearch:
  hosts: ["10.0.0.161:9200","10.0.0.162:9200","10.0.0.163:9200"]
  indices:
    - index: "nginx-elk-access-%{[agent.version]}-%{+yyyy.MM.dd}"
      when.contains:
        tags: "nginx-elk-host"

    - index: "nginx-aaa-access-%{[agent.version]}-%{+yyyy.MM.dd}"
      when.contains:
        tags: "nginx-aaa-host"

    - index: "nginx-ttt-access-%{[agent.version]}-%{+yyyy.MM.dd}"
      when.contains:
        tags: "nginx-ttt-host"

    - index: "nginx-error-%{[agent.version]}-%{+yyyy.MM.dd}"
      when.contains:
        tags: "inginx-error"

setup.ilm.enabled: false
setup.template.name: nginx #搜索关联的模板名称
setup.template.pattern: nginx-*
查看ES中的索引

在kibana中创建索引


分析


做个测试,单独curl几次ttt.test.com,看下kibana中展示变化信息

5.收集tomcat日志
5.1 收集tomcat访问日志
访问日志-------------------->转化为json格式
错误日志(错误日志是java格式)
tomcat+filebeat-------->elasticsearch<-------kibana

#1.安装tomcat
[root@web01 home]# yum install java -y
[root@web01 home]# tar xf apache-tomcat-9.0.26.tar.gz
[root@web01 home]# ln -s /home/apache-tomcat-9.0.26/ /home/tomcat
[root@web01 home]# vim tomcat/conf/server.xml
<Host name="tomcat.qqq.com" appBase="webapps"
unpackWARs="true" autoDeploy="true">
<Valve className="org.apache.catalina.valves.AccessLogValve" directory="logs"
prefix="tomcat.qqq.com_access_log" suffix=".txt" pattern="{"clientip":"%h","ClientUser":"%l","authenticated":"%u","AccessTime":"%t","method":"%r","status":"%s","SendBytes":"%b","Query?string":"%q","partner":"%{Referer}i","AgentVersion":"%{User-Agent}i"}" />
[root@web01 home]# /home/tomcat/bin/startup.sh
#2.启动之后curl几下产生点日志
[root@web01 home]# curl -H Host:tomcat.qqq.com http://10.0.0.6:8080
#3.查看日志是否为json格式
[root@web01 home]# cat /home/tomcat/logs/tomcat.qqq.com_access_log.2021-06-19.txt
{"clientip":"10.0.0.6","ClientUser":"-","authenticated":"-","AccessTime":"[19/Jun/2021:16:19:27 +0800]","method":"GET / HTTP/1.1","status":"200","SendBytes":"11216","Query?string":"","partner":"-","AgentVersion":"curl/7.29.0"}
{"clientip":"10.0.0.6","ClientUser":"-","authenticated":"-","AccessTime":"[19/Jun/2021:16:20:25 +0800]","method":"GET / HTTP/1.1","status":"200","SendBytes":"11216","Query?string":"","partner":"-","AgentVersion":"curl/7.29.0"}
{"clientip":"10.0.0.6","ClientUser":"-","authenticated":"-","AccessTime":"[19/Jun/2021:16:20:25 +0800]","method":"GET / HTTP/1.1","status":"200","SendBytes":"11216","Query?string":"","partner":"-","AgentVersion":"curl/7.29.0"}
{"clientip":"10.0.0.6","ClientUser":"-","authenticated":"-","AccessTime":"[19/Jun/2021:16:20:26 +0800]","method":"GET / HTTP/1.1","status":"200","SendBytes":"11216","Query?string":"","partner":"-","AgentVersion":"curl/7.29.0"}
#1.配置filebeat
[root@web01 filebeat]# cat filebeat.yml
filebeat.inputs:
- type: log
  enabled: true
  paths:
    - /home/tomcat/logs/tomcat.qqq.com_access_log.*.txt
  json.keys_under_root: true #默认false,还会将json解析的日志存储至messages字段
  json.overwrite_keys: true #覆盖默认的key,使用自定义json格式的key

output.elasticsearch:
  hosts: ["10.0.0.161:9200","10.0.0.162:9200","10.0.0.163:9200"]
  index: "tomcat-access-%{[agent.version]}-%{+yyyy.MM.dd}"

setup.ilm.enabled: false
setup.template.name: tomcat #搜索关联的模板名称
setup.template.pattern: tomcat-*

[root@web01 filebeat]# systemctl restart filebeat
刷新几下tomcat网站


如上图。tomcat索引tomcat-access已经有了
在kiabana中创建索引展示


5.2 收集tomcat错误日志
5.2.1 JAVA错误日志的特点
1.报错信息比较多
2.报错信息分很多行
5.2.2 收集java日志的思路
tomcat正常日志是以“日期”开始的,而报错日志中间的错误都不是以“日期”开头,所以我们可以匹配以“日期”开头的一直到下一个日期出现则为一个事件日志。
Elasticsearch正常日志是以[]开头的。而报错日志中间的错误信息不是以[]开头的,所以我们要匹配以[开头的行,一直到下一个[开头的出现则为一个事件日志。https://www.elastic.co/guide/en/beats/filebeat/7.4/multiline-examples.html(看官方例子)
5.2.3 配置filebeat收集tomcat日志
[root@web01 filebeat]# cat filebeat.yml
filebeat.inputs:
- type: log
  enabled: true
  paths:
    - /home/tomcat/logs/tomcat.qqq.com_access_log.*.txt
  json.keys_under_root: true #默认false,还会将json解析的日志存储至messages字段
  json.overwrite_keys: true #覆盖默认的key,使用自定义json格式的key
  tags: [tomcat-access]

- type: log
  enabled: true
  paths:
    - /home/tomcat/logs/catalina.out
  multiline.pattern: '^\d{2}' #匹配以2个数字开头的
  multiline.negate: true
  multiline.match: after
  multiline.max_lines: 10000   #默认最大合并行为500.可根据实际调整
  tags: [tomcat-error]

output.elasticsearch:
  hosts: ["10.0.0.161:9200","10.0.0.162:9200","10.0.0.163:9200"]
  indices:
    - index: "tomcat-access-%{[agent.version]}-%{+yyyy.MM.dd}"
      when.contains:
        tags: "tomcat-access"

    - index: "tomcat-error-%{[agent.version]}-%{+yyyy.MM.dd}"
      when.contains:
        tags: "tomcat-error"


setup.ilm.enabled: false
setup.template.name: tomcat #搜索关联的模板名称
setup.template.pattern: tomcat-*
[root@web01 filebeat]# systemctl restart filebeat

#如果es中有tomcat-error索引,将其删除
#将tomcat/conf/server.xml随便修改一处错误,然后重启tomcat


 489
489


 被折叠的 条评论
为什么被折叠?
被折叠的 条评论
为什么被折叠?
 到【灌水乐园】发言


