


#清华源
pip install -i https://pypi.tuna.tsinghua.edu.cn/simple some-package
#豆瓣源
pip install -i https://pypi.doubanio.com/simple/ xxx
#更新
pip install xxx -i http://pypi.douban.com/simple --trusted-host pypi.douban.com
#国内源升级pip

python -m pip install --upgrade pip -i https://pypi.mirrors.ustc.edu.cn/simple/
python wordcloud install 失败
解决办法如下:
'''1.进入https://www.lfd.uci.edu/~gohlke/pythonlibs/#wordcloud
   2.下载对应版本的whl文件
   例如win10 64位 python3.9 下载:
   wordcloud‑1.8.1‑cp39‑cp39‑win_amd64.whl
   3.找到刚下载好的 wordcloud‑1.8.1‑cp39‑cp39‑win_amd64.whl路径cmd 后pip install xxx
   4.问题成功解决!

'''
global变量的使用
examplex = ''

def fun1():
 global examplex=3


def fun2():
 global examplex
 print(examplex)

fun2()#输出examplex = 3

局部变量给全局变量赋值。
Bottle框架
官网:
https://bottlepy.org/docs/dev/
Bottle 是一个用于 Python 的快速、简单和轻量级的 WSGI 微型网络框架。它作为单个文件模块分发,除了 Python 标准库之外没有任何依赖项。
Flask框架+Modbus485数据采集
欢迎访问Flask — Flask Documentation (1.1.x) (osgeo.cn)
import json
import socket

from time import sleep
from flask_cors import CORS

# from bottle import route, run, template, response

from flask import Flask
#给Flask一个实例化对象,其中__name__入参是你的模块名或者包名,Flask应用会根据这个来确定你的应用路径以及静态文件和模板文件夹的路径
app = Flask(__name__)
CORS(app)
#路由
@app.route('/')
def hello_world():
    # response.content_type = 'application/json'
    s = socket.socket(socket.AF_INET, socket.SOCK_STREAM)
    # 建立连接---发送连接请求
    s.connect(('192.168.11.100', 23))

    t =[]


    for data in ['020300000002C438', '030300000002C5E9', '040300000002C45E']:
        # 16进制字符串转换为字节序列
        data = bytes.fromhex(data)

        # data =  hex_to_bytes(hez)
        s.send(data)
        data = s.recv(2048)
        print(type(data), data.hex())
        str1 = data.hex()
        print(type(str1), str1[6:10])
        hexx = str1[6:10]
        tempture = str1[10:14]

        print(str1[1], '湿度:', float(int('0x' + hexx, 16) / 10))
        print(str1[1], '温度:', float(int('0x' + tempture, 16) / 10))
        jsona = {'collect_index': str1[1], 'humidity': float(int('0x' + hexx, 16) / 10),
                  'temperature': float(int('0x' + tempture, 16) / 10)}
        ret = json.dumps(jsona)
        t.append(jsona)
        print(jsona)

    g = {'d': t}
    uu = json.dumps(g)
    return uu
#运行
if __name__ == '__main__':

    app.run(debug=True,host='192.168.3.131',port=6661)
前端部分
<!DOCTYPE html>
<html lang="en">
<head>
    <meta charset="UTF-8">
    <meta http-equiv="X-UA-Compatible" content="IE=edge">
    <meta name="viewport" content="width=device-width, initial-scale=1.0">
    <title>监测</title>
    <style src="./css/bootstrap.min.css" rel="stylesheet"></style>
    <script src="./js/echarts.js"></script>
    <link rel="stylesheet" href="https://cdn.jsdelivr.net/npm/bootstrap@5.2.3/dist/css/bootstrap.min.css">
    <script src="./js/jquery-3.5.1.min.js"></script>
</head>
<body>


    <div class="container">

    <h1 id="f" onmouseleave="loss()">数据加载中请等待20秒......</h1>
      <div class="row" >

        <div class="col-xs-6 col-md-6" >

          <div id="main" style="height: 300px; text-align: center;"> </div>
        </div>
        <div class="col-xs-6 col-md-6" >

          <div id="main01" style="height: 300px; text-align: center;"> </div>
        </div>
    </div>
    <div class="row">

      <div class="col-xs-6 col-md-6" >

        <div id="main02" style="height: 300px; text-align: center;"> </div>
      </div>
        <div class="col-xs-6 col-md-6" >

          <div id="main03" style="height: 300px; text-align: center;"> </div>
        </div>
    </div>
    <div class="row">

      <div class="col-xs-6 col-md-6" >

        <div id="main04" style="height: 300px; text-align: center;"> </div>
      </div>
        <div class="col-xs-6 col-md-6" >

          <div id="main05" style="height: 300px; text-align: center;"> </div>
        </div>
    </div>
    </div>


    <script>
      function loss(){
        $('#f').hide()
      }
    var chartDom = document.getElementById('main');
    var myChart = echarts.init(chartDom);
    var option;
    //--------------------------------------------------------------
    var chartDom01 = document.getElementById('main01');
var myChart01 = echarts.init(chartDom01);
var option01;
//------------------------------------------------
var chartDom02 = document.getElementById('main02');
var myChart02 = echarts.init(chartDom02);
var option02;
//------------------------------------------------
var chartDom03 = document.getElementById('main03');
var myChart03 = echarts.init(chartDom03);
var option03;
//------------------------------------------------
var chartDom04 = document.getElementById('main04');
var myChart04 = echarts.init(chartDom04);
var option04;
//------------------------------------------------
var chartDom05 = document.getElementById('main05');
var myChart05 = echarts.init(chartDom05);
var option05;
//------------------------------------------------
      setInterval(function(){
       BaseUrl = '/flask'
        $.ajax({
        url:BaseUrl,
        type:'get',
        success:function(res){
              let c = JSON.parse(res)
          console.log(typeof(c) )
          console.log(c.d[0].humidity)
          option = {
  series: [
    {
      type: 'gauge',
      center: ['50%', '60%'],
      startAngle: 200,
      endAngle: -20,
      min: 0,
      max: 60,
      splitNumber: 10,
      itemStyle: {
        color: '#FFAB91'
      },
      progress: {
        show: true,
        width: 22
      },
      pointer: {
        show: false
      },
      axisLine: {
        lineStyle: {
          width: 22
        }
      },
      axisTick: {
        distance: -45,
        splitNumber: 5,
        lineStyle: {
          width: 2,
          color: '#999'
        }
      },
      splitLine: {
        distance: -52,
        length: 14,
        lineStyle: {
          width: 3,
          color: '#999'
        }
      },
      axisLabel: {
        distance: -20,
        color: '#999',
        fontSize: 14
      },
      anchor: {
        show: false
      },
      title: {
        show: false
      },
      detail: {
        valueAnimation: true,
        width: '60%',
        lineHeight: 40,
        borderRadius: 6,
        offsetCenter: [0, '-15%'],
        fontSize: 45,
        fontWeight: 'bolder',
        formatter: '{value} °C',
        color: 'inherit'
      },
      data: [
        {
          value: c.d[0].temperature
        }
      ]
    },
    {
      type: 'gauge',
      center: ['50%', '60%'],
      startAngle: 200,
      endAngle: -20,
      min: 0,
      max: 60,
      itemStyle: {
        color: '#FD7347'
      },
      progress: {
        show: true,
        width: 8
      },
      pointer: {
        show: false
      },
      axisLine: {
        show: false
      },
      axisTick: {
        show: false
      },
      splitLine: {
        show: false
      },
      axisLabel: {
        show: false
      },
      detail: {
        show: false
      },
      title:{
        show:true
      },
      data: [
        {
          value: c.d[0].temperature,name:'2号采集器温度'
        }
      ]
    }
  ]
};
option && myChart.setOption(option);

//------------------------------------------------------------------->
option02 = {
  series: [
    {
      type: 'gauge',
      center: ['50%', '60%'],
      startAngle: 200,
      endAngle: -20,
      min: 0,
      max: 60,
      splitNumber: 10,
      itemStyle: {
        color: '#FFAB91'
      },
      progress: {
        show: true,
        width: 22
      },
      pointer: {
        show: false
      },
      axisLine: {
        lineStyle: {
          width: 22
        }
      },
      axisTick: {
        distance: -45,
        splitNumber: 5,
        lineStyle: {
          width: 2,
          color: '#999'
        }
      },
      splitLine: {
        distance: -52,
        length: 14,
        lineStyle: {
          width: 3,
          color: '#999'
        }
      },
      axisLabel: {
        distance: -20,
        color: '#999',
        fontSize: 14
      },
      anchor: {
        show: false
      },
      title: {
        show: false
      },
      detail: {
        valueAnimation: true,
        width: '60%',
        lineHeight: 40,
        borderRadius: 6,
        offsetCenter: [0, '-15%'],
        fontSize: 45,
        fontWeight: 'bolder',
        formatter: '{value} °C',
        color: 'inherit'
      },
      data: [
        {
          value: c.d[1].temperature
        }
      ]
    },
    {
      type: 'gauge',
      center: ['50%', '60%'],
      startAngle: 200,
      endAngle: -20,
      min: 0,
      max: 60,
      itemStyle: {
        color: '#FD7347'
      },
      progress: {
        show: true,
        width: 8
      },
      pointer: {
        show: false
      },
      axisLine: {
        show: false
      },
      axisTick: {
        show: false
      },
      splitLine: {
        show: false
      },
      axisLabel: {
        show: false
      },
      title:{
        show:true
      },
      detail: {
        show: false
      },
      data: [
        {
          value: c.d[1].temperature,name:'3号采集器温度'
        }
      ]
    }
  ]
};
option02 && myChart02.setOption(option02);

//------------------------------------------------------------------->
option01 = {
  series: [
    {
      type: 'gauge',
      axisLine: {
        lineStyle: {
          width: 5,
          color: [
            [0.3, '#67e0e3'],
            [0.7, '#37a2da'],
            [1, '#fd666d']
          ]
        }
      },
      pointer: {
        itemStyle: {
          color: 'inherit'
        }
      },
      axisTick: {
        distance: -15,
        length: 8,
        lineStyle: {
          color: '#fff',
          width: 2
        }
      },
      splitLine: {
        distance: -30,
        length: 8,
        lineStyle: {
          color: '#fff',
          width: 4
        }
      },
      axisLabel: {
        color: 'inherit',
        distance: 40,
        fontSize: 20
      },
      detail: {
        valueAnimation: true,
        formatter: '{value} %RH',
        color: 'inherit'
      },
      data: [
        {
          value: c.d[0].humidity,name : '2号采集器湿度'
        }
      ]
    }
  ]
};
option01 && myChart01.setOption(option01);
//-------------------------------------------------------------------->
option03 = {
  series: [
    {
      type: 'gauge',
      axisLine: {
        lineStyle: {
          width: 5,
          color: [
            [0.3, '#67e0e3'],
            [0.7, '#37a2da'],
            [1, '#fd666d']
          ]
        }
      },
      pointer: {
        itemStyle: {
          color: 'inherit'
        }
      },
      axisTick: {
        distance: -15,
        length: 8,
        lineStyle: {
          color: '#fff',
          width: 2
        }
      },
      splitLine: {
        distance: -30,
        length: 8,
        lineStyle: {
          color: '#fff',
          width: 4
        }
      },
      axisLabel: {
        color: 'inherit',
        distance: 40,
        fontSize: 20
      },
      detail: {
        valueAnimation: true,
        formatter: '{value} %RH',
        color: 'inherit'
      },
      data: [
        {
          value: c.d[1].humidity,name : '3号采集器湿度'
        }
      ]
    }
  ]
};
option03 && myChart03.setOption(option03);
//-------------------------------------------------------------------->
//------------------------------------------------------------------->
option04 = {
  series: [
    {
      type: 'gauge',
      center: ['50%', '60%'],
      startAngle: 200,
      endAngle: -20,
      min: 0,
      max: 60,
      splitNumber: 10,
      itemStyle: {
        color: '#FFAB91'
      },
      progress: {
        show: true,
        width: 22
      },
      pointer: {
        show: false
      },
      axisLine: {
        lineStyle: {
          width: 22
        }
      },
      axisTick: {
        distance: -45,
        splitNumber: 5,
        lineStyle: {
          width: 2,
          color: '#999'
        }
      },
      splitLine: {
        distance: -52,
        length: 14,
        lineStyle: {
          width: 3,
          color: '#999'
        }
      },
      axisLabel: {
        distance: -20,
        color: '#999',
        fontSize: 14
      },
      anchor: {
        show: false
      },
      title: {
        show: false
      },
      detail: {
        valueAnimation: true,
        width: '60%',
        lineHeight: 40,
        borderRadius: 6,
        offsetCenter: [0, '-15%'],
        fontSize: 45,
        fontWeight: 'bolder',
        formatter: '{value} °C',
        color: 'inherit'
      },
      data: [
        {
          value: c.d[1].temperature
        }
      ]
    },
    {
      type: 'gauge',
      center: ['50%', '60%'],
      startAngle: 200,
      endAngle: -20,
      min: 0,
      max: 60,
      itemStyle: {
        color: '#FD7347'
      },
      progress: {
        show: true,
        width: 8
      },
      pointer: {
        show: false
      },
      axisLine: {
        show: false
      },
      axisTick: {
        show: false
      },
      splitLine: {
        show: false
      },
      axisLabel: {
        show: false
      },
      title:{
        show:true
      },
      detail: {
        show: false
      },
      data: [
        {
          value: c.d[2].temperature,name:'4号采集器温度'
        }
      ]
    }
  ]
};
option04 && myChart04.setOption(option04);
//----------------------------------------------------------------->
option05 = {
  series: [
    {
      type: 'gauge',
      axisLine: {
        lineStyle: {
          width: 5,
          color: [
            [0.3, '#67e0e3'],
            [0.7, '#37a2da'],
            [1, '#fd666d']
          ]
        }
      },
      pointer: {
        itemStyle: {
          color: 'inherit'
        }
      },
      axisTick: {
        distance: -15,
        length: 8,
        lineStyle: {
          color: '#fff',
          width: 2
        }
      },
      splitLine: {
        distance: -30,
        length: 8,
        lineStyle: {
          color: '#fff',
          width: 4
        }
      },
      axisLabel: {
        color: 'inherit',
        distance: 40,
        fontSize: 20
      },
      detail: {
        valueAnimation: true,
        formatter: '{value} %RH',
        color: 'inherit'
      },
      data: [
        {
          value: c.d[2].humidity ,name : '4号采集器湿度'
        }
      ]
    }
  ]
};
option05 && myChart05.setOption(option05);
//-------------------------------------------------------------------->
        },
        error:function(err){
         console.log(err)
        }
    })

      },3000)


</script>


</body>
</html>
python的列表[],元组(),字典{}相关知识点
列表是动态的,属于可变序列,它的元素可以随时增加、修改或者删除,而元组是静态的,属于不可变序列,无法增加、删除、修改元素,除非整体替换。
>>> a = ['a', 'b', 'c', 'd']
>>> b = ['1', '2', '3', '4']
>>> list(zip(a, b))
[('a', '1'), ('b', '2'), ('c', '3'), ('d', '4')]

result = zip(a, b)

origin = zip(*result)  #前面加*号,事实上*号也是一个特殊的运算符,叫解包运算符
单星号(*):*agrs
形参前使用:作用是 接受多个参数
def foo(param1, *param2):
    print param1   # 1
    print param2   # (2, 3, 4, 5)

foo(1,2,3,4,5)
实参前使用:作用是解压参数列表
def foo(bar, lee):
    print bar3   # 1
    print lee   # 2

l = [1, 2]
foo(*l)
双星号(**):**kwargs
形参前使用:将参数以字典的形式导入
def bar(param1, **param2):
    print param1   # 1
    print param2   # {‘a’: 2, ‘b’: 3}
bar(1,a=2,b=3)
1
2
3
4
当然这两个用法可以同时出现在一个函数中:例如
def foo(a, b=10, *args, **kwargs):
    print a   # 1
    print b   # 2
    print args   # 3 4
    print kwargs   # {‘e’: 5, ‘g’: 7, ‘f’: 6}

foo(1, 2, 3, 4, e=5, f=6, g=7)
彩色命令行
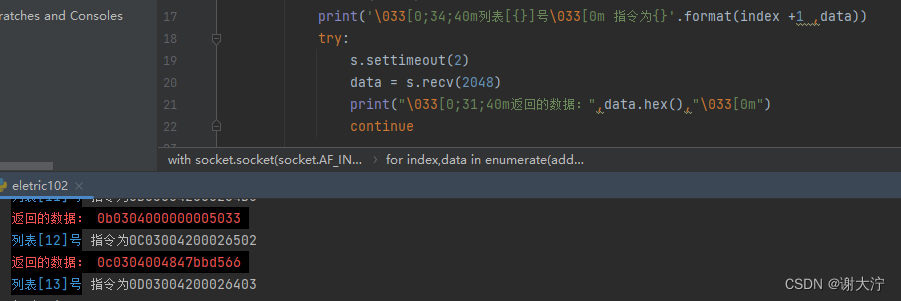
标准格式
print("\033[显示方式;前景颜色;背景颜色m…\033[0m")


 1237
1237


 被折叠的 条评论
为什么被折叠?
被折叠的 条评论
为什么被折叠?
 到【灌水乐园】发言


