


 该代码展示了如何在MATLAB中读取并分析LAI(叶面积指数)、LCC(叶片叶绿素含量)和NDVI(归一化植被指数)的时间序列数据,然后绘制三条线图来可视化这些变量随时间的变化。
先上效果图:
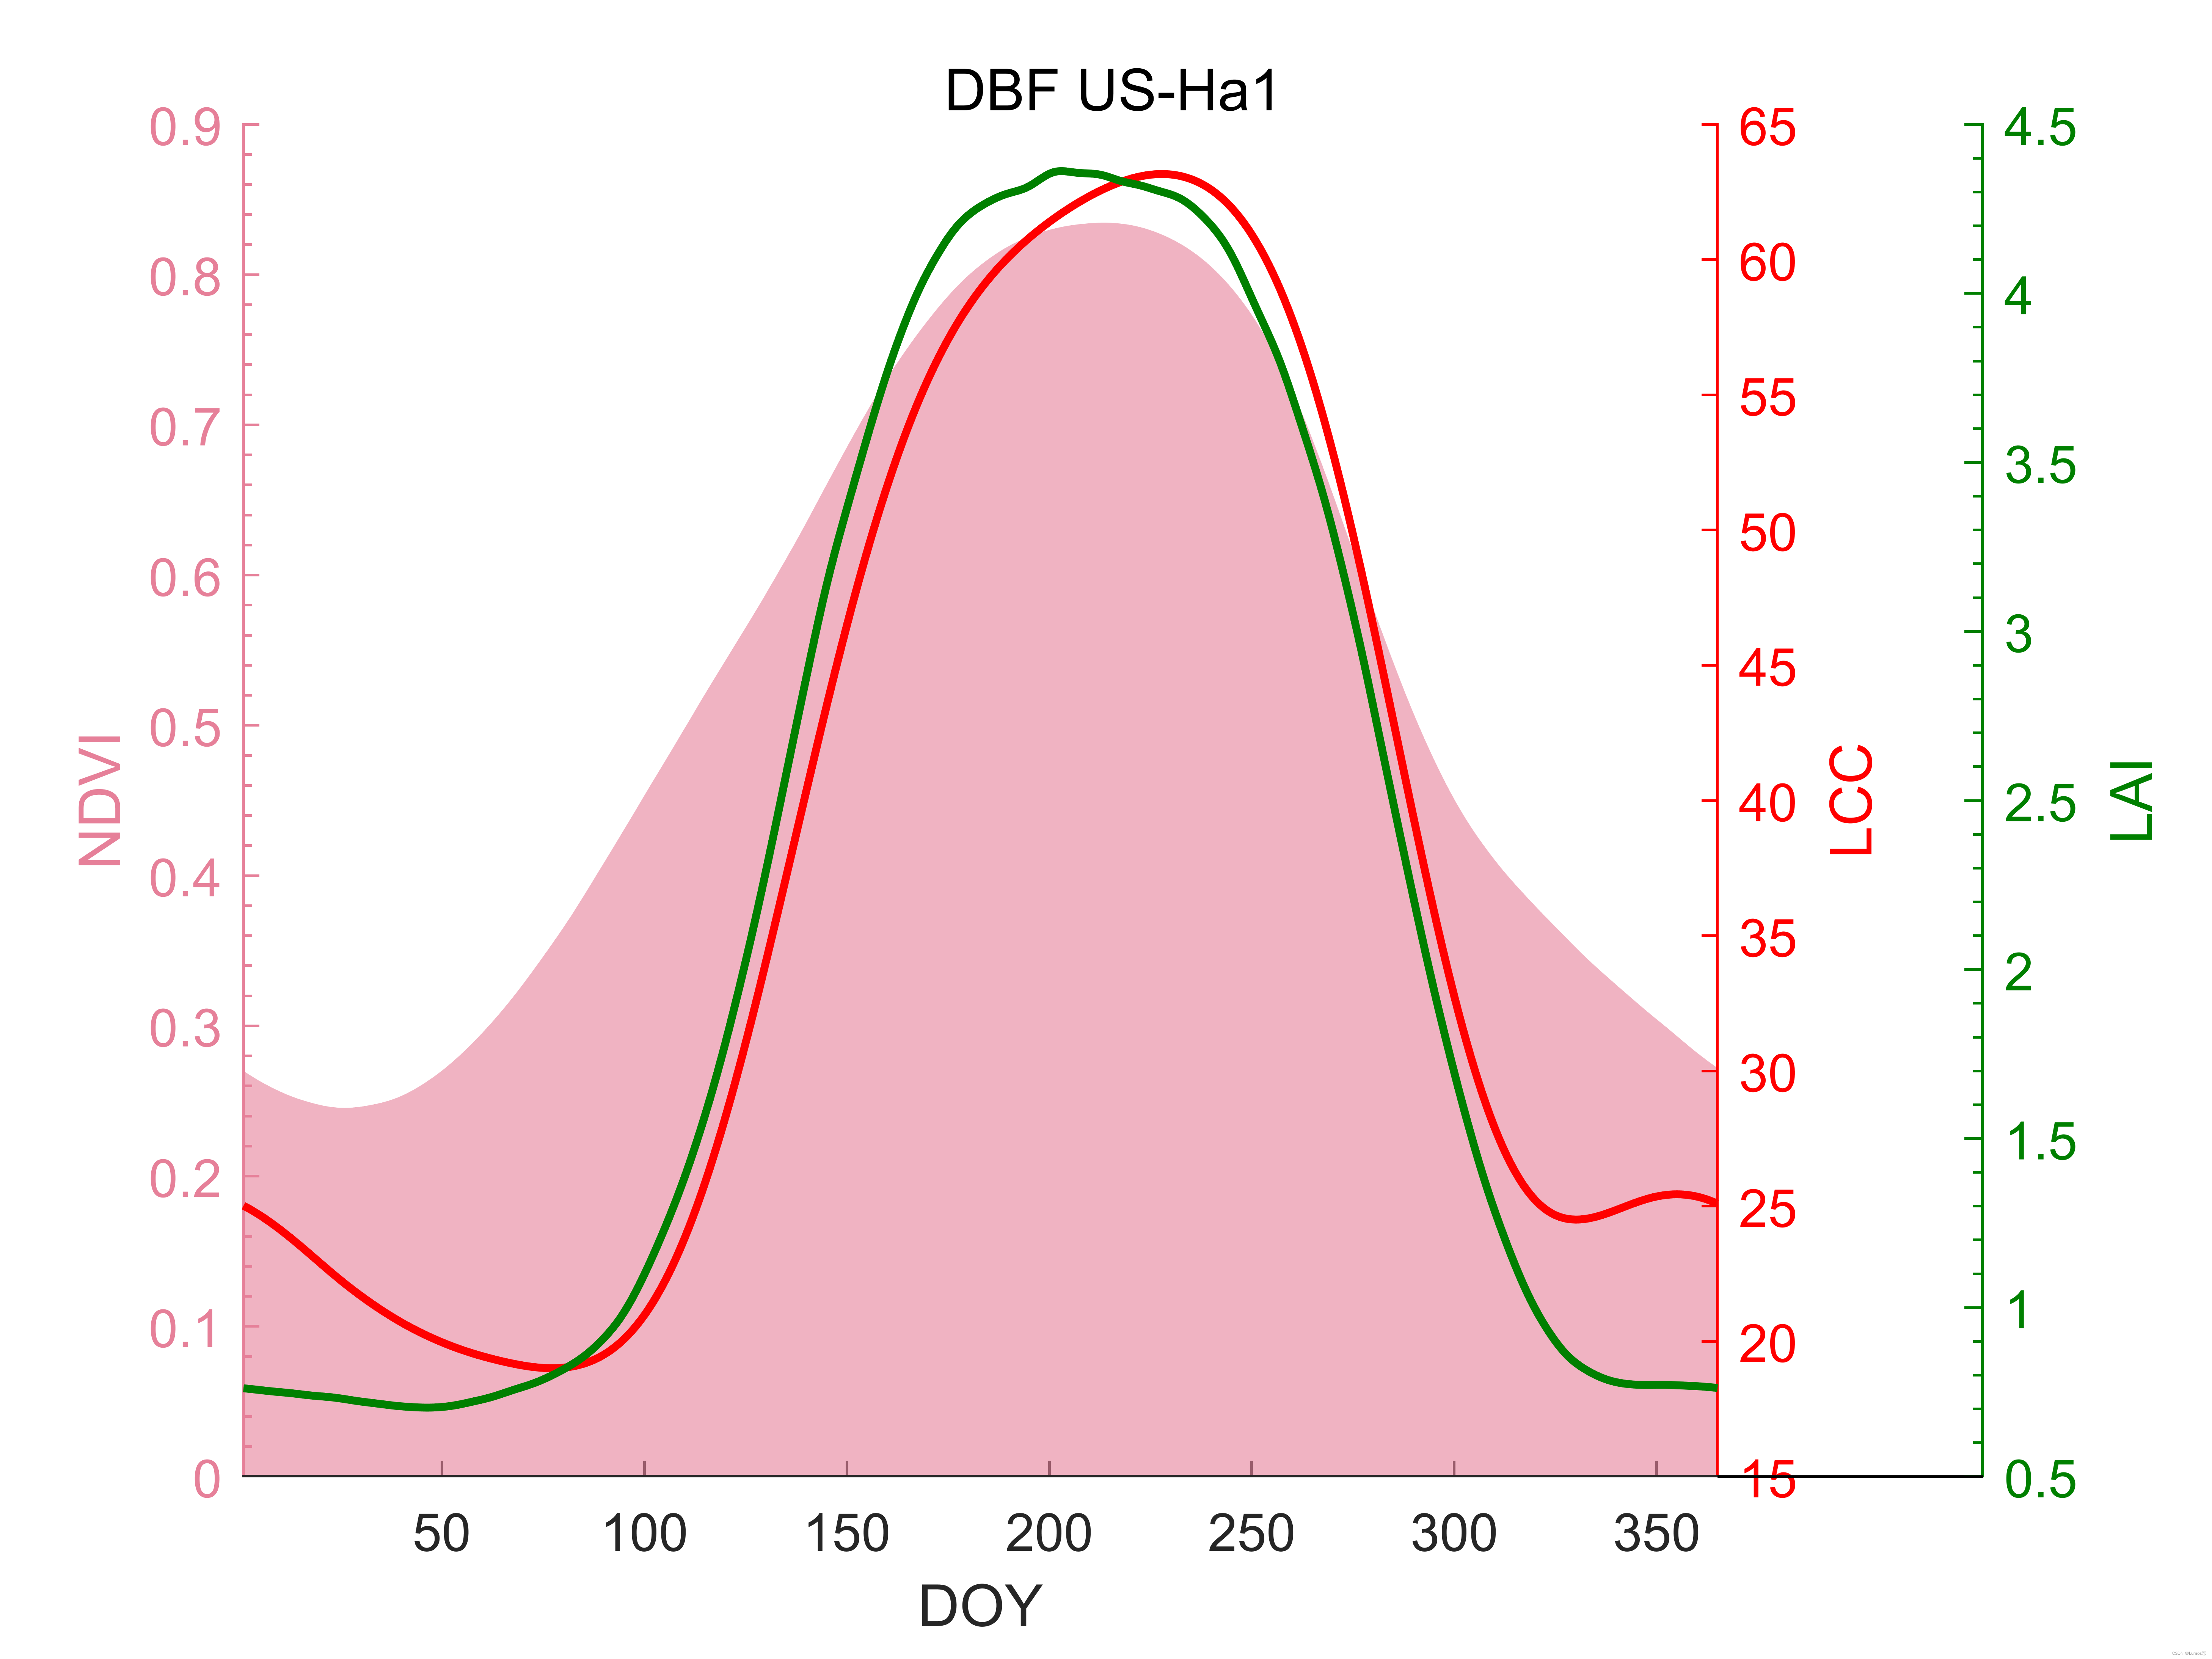
下列代码中需要三个时序值:LAI(叶面积指数) LCC(叶片叶绿素含量) NDVI(归一化植被指数)
clc;
clear all;
close all;

% 第一个bar的数据
DOY = 1:1:365;
LAI = xlsread('D:\DeskTop\Prosail(LAI+LCC+LAI_LCC)\12增加DBF的站点\重新提取LAI和新增的LCC\3、result_LAI_LCC\均值LAI_SSA_L50.xls','A:A'); % F:F为CRO ;
% 第二个line的数据
LCC = xlsread('D:\DeskTop\Prosail(LAI+LCC+LAI_LCC)\12增加DBF的站点\重新提取LAI和新增的LCC\3、result_LAI_LCC\7个LCC文件的均值(许)_SSA_L40.xls','A:A'); % F:F为CRO;
% 第三个line的数据

NDVI = xlsread('D:\DeskTop\Prosail(LAI+LCC+LAI_LCC)\12增加DBF的站点\重新提取LAI和新增的LCC\4、不同植被类型的LAI与LCC对NDVI的贡献(LAI与LCC均平滑_NDVI不能平滑)\6种生态类型的结果\1、CRO\CRO1\3、LAI时序值\2、LCC均值\PROSAIL_5B_MATLAB_2017\LAI时序值_LCC均值.xlsx', 2, '1:1');;
[ha,h] = barplotplot(DOY,NDVI,DOY,LCC,DOY,LAI,[1,365],{'DOY'},{'NDVI','LCC','LAI'}); % xlim可以指定, % 为[]表示采用默认值

function [ha, h] = barplotplot(x1,y1,x2,y2,x3,y3,xlim1, xlab, ylab)

ha(1) = axes('ycolor',[0.9 0.5 0.6],'yminortick','on','xminortick','off');
hold on;
h(1) = fill([x1,x1(end:-1:1)],[y1,zeros(1, length(y1))],[0.9 0.5 0.6],'FaceAlpha',0.6,'EdgeAlpha',0);
% h(1) = bar(x1, y1,'parent',ha(1),'facecolor','b');
if ~isempty(xlim1)
    set(ha(1), 'xlim', xlim1);
end
xlim1 = get(ha(1),'xlim');


% 画第二条线
pos1=get(ha(1),'position');
ha(2) = axes('position',pos1,'color','none','ycolor','r','yaxislocation','right','xlim',xlim1, 'xtick', []);
h(2) = line(x2,y2,'color','r','parent',ha(2),'linewidth',1.5,'linestyle','-');


% 画第三条线
pos1(1)=pos1(1)-0.02;
pos1(3) = pos1(3)*.86;
set([ha(1);ha(2)],'position',pos1);
pos3 = pos1;
pos3(3) = pos3(3)+.12;
xlim3 = xlim1;
xlim3(2) = xlim3(1)+(xlim1(2)-xlim1(1))/pos1(3)*pos3(3);
ha(3) = axes('position',pos3, 'color','none','ycolor',[0,0.5,0],'xlim',xlim3, ...
    'xtick',[],'yaxislocation','right','yminortick','on');
% 截取多余部分
[x3, ind] = sort(x3, 2, 'ascend');
y3 = y3(ind);
ind2 =  (x3<=xlim1(2));
y3 = y3(ind2);
x3 = x3(ind2);
h(3) = line(x3, y3,'color',[0,.5,0],'linewidth',1.5,'linestyle','-','parent',ha(3));
% 隐藏多余的轴
ylim3 = get(ha(3), 'ylim');
line([xlim1(2),xlim3(2)],[ylim3(1),ylim3(1)],'parent',ha(3),'color','w');


if nargin == 7; return; end
% 加ylabels
title('DBF US-Ha1')
hylab = get([ha(1);ha(2);ha(3)],'ylabel');
hxlab = get(ha(1),'xlabel');
set(hylab{1},'string',ylab{1});
set(hylab{2},'string',ylab{2});
set(hylab{3},'string',ylab{3});
set(hxlab,'string', xlab);
print(gcf,'-dpng','-r1000','DBF US-Ha1.png')

hold off;
end


 2599
2599


 被折叠的 条评论
为什么被折叠?
被折叠的 条评论
为什么被折叠?
 到【灌水乐园】发言


