


目录
简介

Arthas 是一款线上监控诊断产品,通过全局视角实时查看应用 load、内存、gc、线程的状态信息,并能在不修改应用代码的情况下,对业务问题进行诊断,包括查看方法调用的出入参、异常,监测方法执行耗时,类加载信息等,大大提升线上问题排查效率。
官网:简介 | arthasarthas 使用文档![]() https://arthas.aliyun.com/doc
https://arthas.aliyun.com/doc
命令功能分类
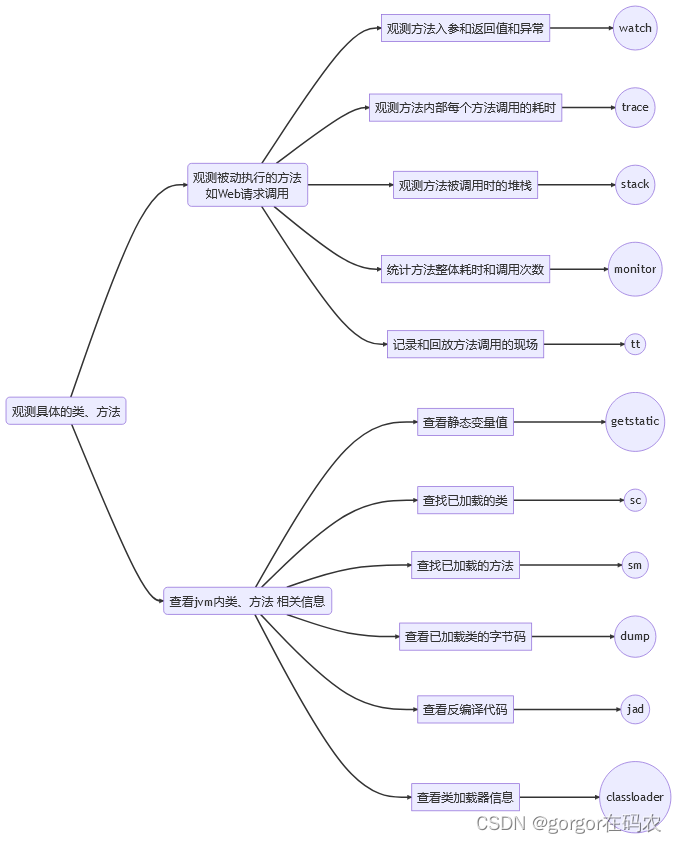
a.观测具体的类、方法【重点】
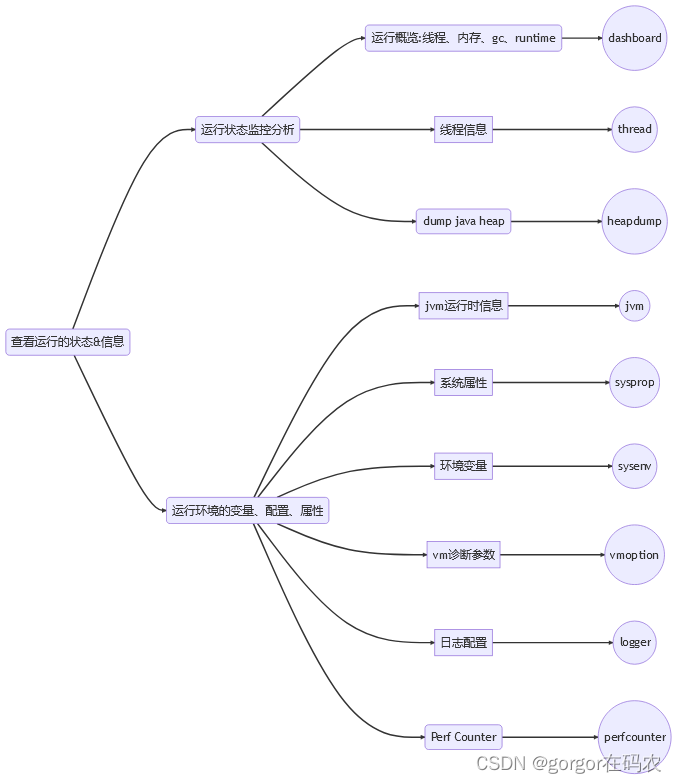
b.查看运行的状态&信息
c.我想改变程序行为
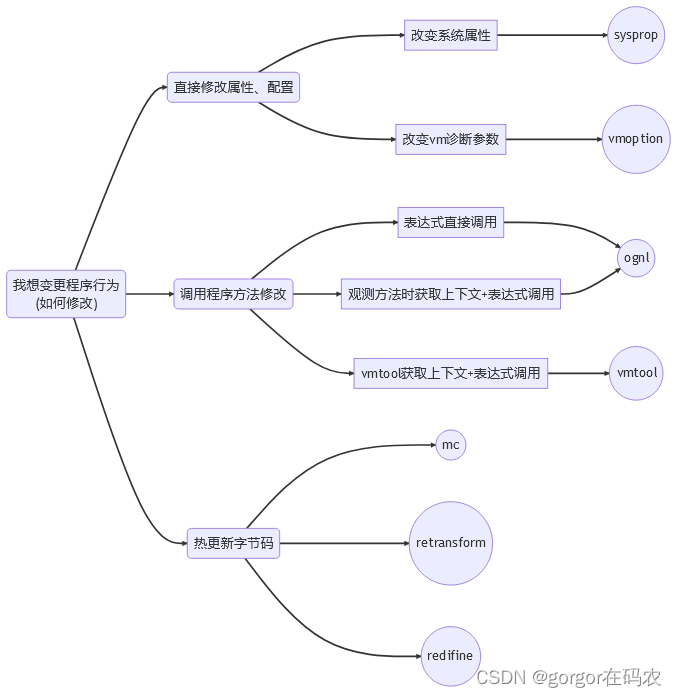
命令介绍
案例代码
import java.util.ArrayList;
import java.util.Iterator;
import java.util.List;
import java.util.Random;
import java.util.concurrent.TimeUnit;

public class MathGame {
    private static Random random = new Random();
    private int illegalArgumentCount = 0;

    public MathGame() {
    }

    public static void main(String[] args) throws InterruptedException {
        MathGame game = new MathGame();

        while(true) {
            game.run();
            TimeUnit.SECONDS.sleep(1L);
        }
    }

    public void run() throws InterruptedException {
        try {
            int number = random.nextInt() / 10000;
            List<Integer> primeFactors = this.primeFactors(number);
            print(number, primeFactors);
        } catch (Exception var3) {
            System.out.println(String.format("illegalArgumentCount:%3d, ", this.illegalArgumentCount) + var3.getMessage());
        }

    }

    public static void print(int number, List<Integer> primeFactors) {
        StringBuffer sb = new StringBuffer(number + "=");
        Iterator var3 = primeFactors.iterator();

        while(var3.hasNext()) {
            int factor = (Integer)var3.next();
            sb.append(factor).append('*');
        }

        if (sb.charAt(sb.length() - 1) == '*') {
            sb.deleteCharAt(sb.length() - 1);
        }

        System.out.println(sb);
    }

    public List<Integer> primeFactors(int number) {
        if (number < 2) {
            ++this.illegalArgumentCount;
            throw new IllegalArgumentException("number is: " + number + ", need >= 2");
        } else {
            List<Integer> result = new ArrayList();
            int i = 2;

            while(i <= number) {
                if (number % i == 0) {
                    result.add(i);
                    number /= i;
                    i = 2;
                } else {
                    ++i;
                }
            }

            return result;
        }
    }
}-
命令一: watch
说明
让你能方便的观察到指定函数的调用情况。能观察到的范围为:返回值、抛出异常、入参,通过编写 OGNL 表达式进行对应变量的查看。
参数说明
watch 的参数比较多,主要是因为它能在 4 个不同的场景观察对象
| 参数名称 | 参数说明 |
|---|---|
| class-pattern | 类名表达式匹配 |
| method-pattern | 函数名表达式匹配 |
| express | 观察表达式,默认值:{params, target, returnObj} |
| condition-express | 条件表达式 |
| [b] | 在函数调用之前观察 |
| [e] | 在函数异常之后观察 |
| [s] | 在函数返回之后观察 |
| [f] | 在函数结束之后(正常返回和异常返回)观察 |
| [E] | 开启正则表达式匹配,默认为通配符匹配 |
| [x:] | 指定输出结果的属性遍历深度,默认为 1,最大值是 4 |
[m <arg>] | 指定 Class 最大匹配数量,默认值为 50。长格式为[maxMatch <arg>]。 |
这里重点要说明的是观察表达式,观察表达式的构成主要由 ognl 表达式组成,所以你可以这样写"{params,returnObj}",只要是一个合法的 ognl 表达式,都能被正常支持。
观察的维度也比较多,主要体现在参数 advice 的数据结构上。Advice 参数最主要是封装了通知节点的所有信息。请参考表达式核心变量中关于该节点的描述。
- 特殊用法请参考:https://github.com/alibaba/arthas/issues/71在新窗口打开
- OGNL 表达式官网:https://commons.apache.org/proper/commons-ognl/language-guide.html
命令实践
观察函数调用返回时的参数、this 对象和返回值
watch com.example.threaddemo.MathGame primeFactors -x 2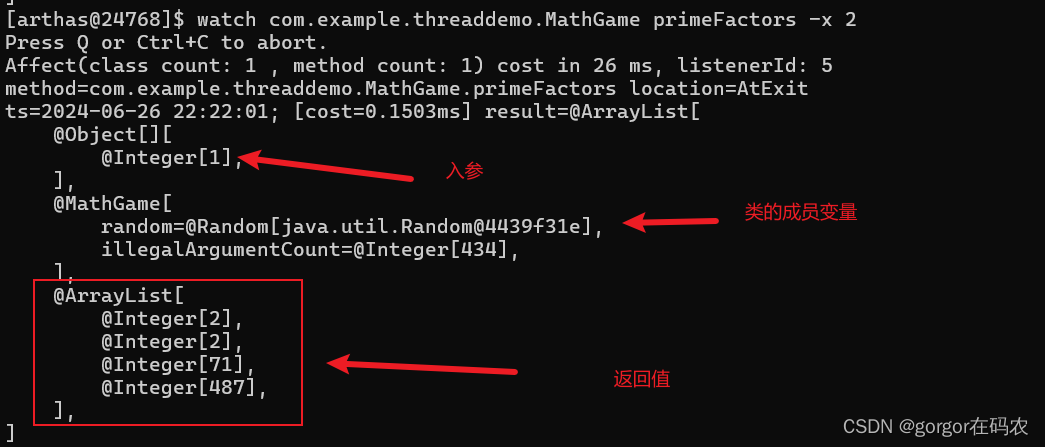
同时观察函数调用前和函数返回后
watch com.example.threaddemo.MathGame primeFactors "{params,target,returnObj}" -x 2 -b -s -n 2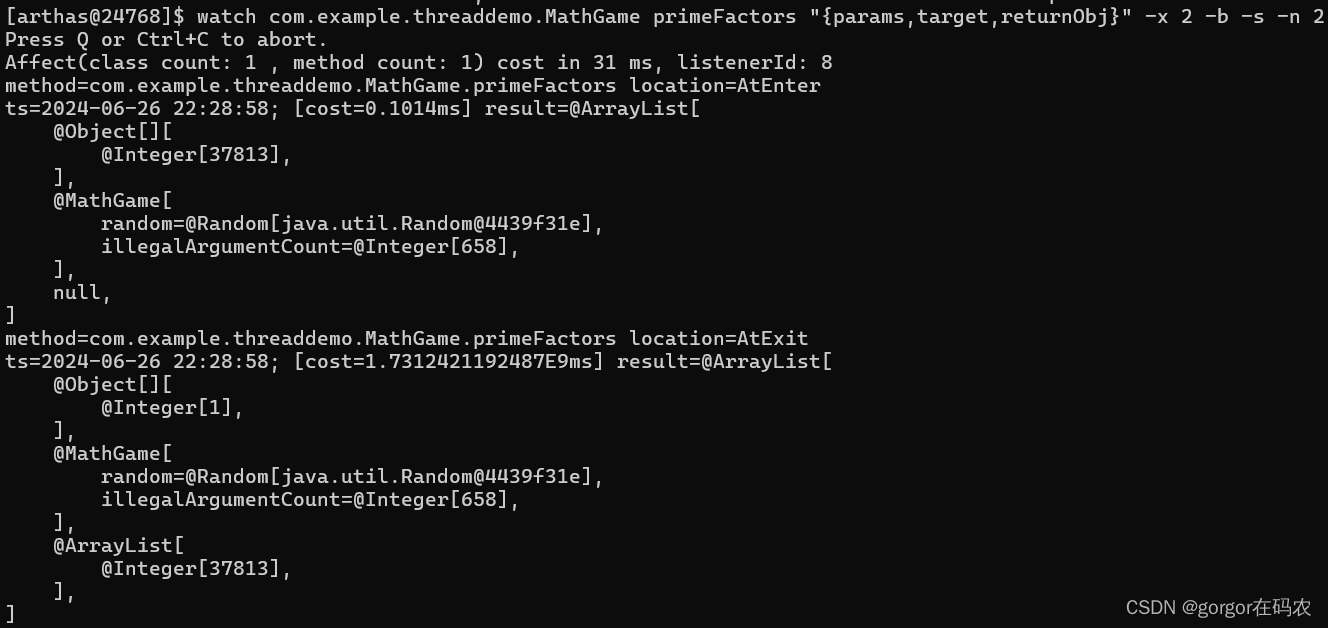
观察异常信息的例子
-e表示抛出异常时才触发- express 中,表示异常信息的变量是
throwExp
watch com.example.threaddemo.MathGame primeFactors "{params[0],throwExp}" -e -x 2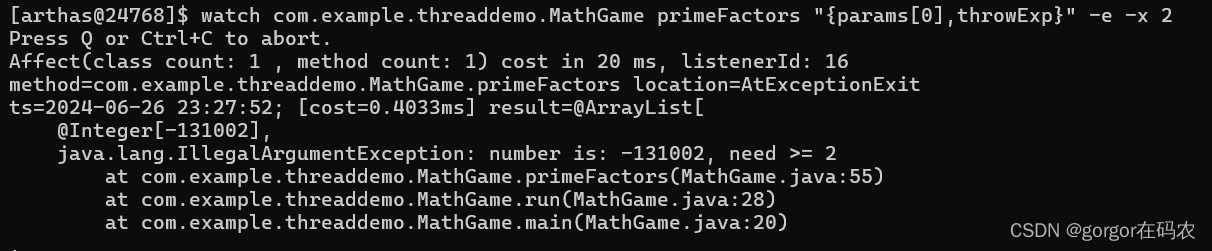
按照耗时进行过滤
#cost>0.1(单位是ms)表示只有当耗时大于 0.1ms 时才会输出,过滤掉执行时间小于 0.1ms 的调用
watch com.example.threaddemo.MathGame primeFactors '{params, returnObj}' '#cost>0.1' -x 2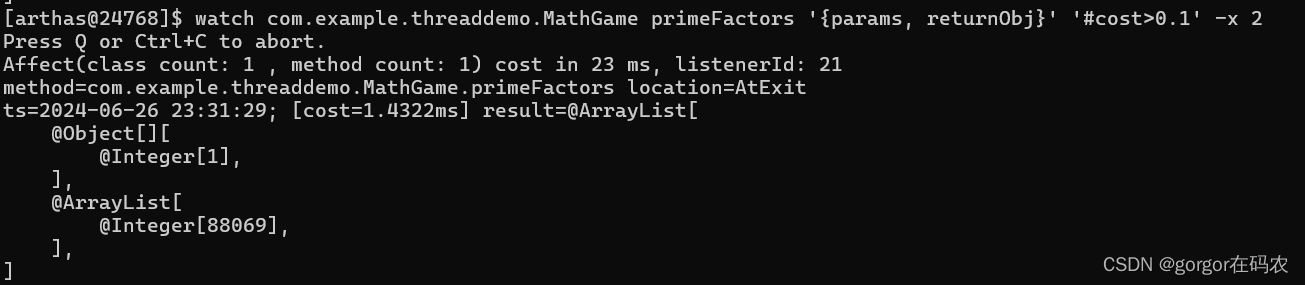
观察当前对象中的属性
如果想查看函数运行前后,当前对象中的属性,可以使用target关键字,代表当前对象
$ watch com.example.threaddemo.MathGame primeFactors 'target'
Press Ctrl+C to abort.
Affect(class-cnt:1 , method-cnt:1) cost in 52 ms.
ts=2018-12-03 19:41:52; [cost=0.477882ms] result=@MathGame[
    random=@Random[java.util.Random@522b408a],
    illegalArgumentCount=@Integer[13355],
]
然后使用target.field_name访问当前对象的某个属性
$ watch com.example.threaddemo.MathGame primeFactors 'target.illegalArgumentCount'
Press Ctrl+C to abort.
Affect(class-cnt:1 , method-cnt:1) cost in 67 ms.
ts=2018-12-03 20:04:34; [cost=131.303498ms] result=@Integer[8]
ts=2018-12-03 20:04:35; [cost=0.961441ms] result=@Integer[8]
获取类的静态字段、调用类的静态函数的例子
[arthas@6527]$ watch com.example.threaddemo.MathGame * '{params,@com.example.threaddemo.MathGame@random.nextInt(100)}' -n 1 -x 2
Press Q or Ctrl+C to abort.
Affect(class count: 1 , method count: 5) cost in 34 ms, listenerId: 3
ts=2021-01-05 21:35:20; [cost=0.173966ms] result=@ArrayList[
    @Object[][
        @Integer[-138282],
    ],
    @Integer[89],
]
-
命令二:trace
说明
方法内部调用路径,并输出方法路径上的每个节点上耗时
参数说明
| 参数名称 | 参数说明 |
|---|---|
| class-pattern | 类名表达式匹配 |
| method-pattern | 方法名表达式匹配 |
| condition-express | 条件表达式 |
| [E] | 开启正则表达式匹配,默认为通配符匹配 |
[n:] | 命令执行次数 |
#cost | 方法执行耗时 |
[m <arg>] | 指定 Class 最大匹配数量,默认值为 50。长格式为[maxMatch <arg>]。 |
这里重点要说明的是条件表达式,条件表达式的构成主要由 ognl 表达式组成,所以你可以这样写"params[0]<0",只要是一个合法的 ognl 表达式,都能被正常支持。
命令实践
trace函数
[arthas@14964]$ trace com.example.threaddemo.MathGame run
Press Q or Ctrl+C to abort.
Affect(class count: 1 , method count: 1) cost in 117 ms, listenerId: 1
`---ts=2024-06-27 10:44:00;thread_name=main;id=1;is_daemon=false;priority=5;TCCL=sun.misc.Launcher$AppClassLoader@18b4aac2
    `---[0.406501ms] com.example.threaddemo.MathGame:run()
        `---[13.14% 0.0534ms ] com.example.threaddemo.MathGame:primeFactors() #28 [throws Exception]
结果里的 #24,表示在 run 函数里,在源文件的第24行调用了primeFactors()函数。
包含 jdk 的函数
[arthas@14964]$ trace --skipJDKMethod false  com.example.threaddemo.MathGame run
Press Q or Ctrl+C to abort.
Affect(class count: 1 , method count: 1) cost in 23 ms, listenerId: 5
`---ts=2024-06-27 10:47:51;thread_name=main;id=1;is_daemon=false;priority=5;TCCL=sun.misc.Launcher$AppClassLoader@18b4aac2
    `---[0.402799ms] com.example.threaddemo.MathGame:run()
        +---[9.51% 0.0383ms ] java.util.Random:nextInt() #27
        +---[12.34% 0.0497ms ] com.example.threaddemo.MathGame:primeFactors() #28 [throws Exception]
        +---[0.77% 0.0031ms ] java.lang.StringBuilder:<init>() #31
        +---[17.11% 0.0689ms ] java.lang.String:format() #31
        +---[1.19% min=0.001601ms,max=0.003201ms,total=0.004802ms,count=2] java.lang.StringBuilder:append() #31
        +---[1.37% 0.005501ms ] java.lang.Exception:getMessage() #31
        +---[0.57% 0.0023ms ] java.lang.StringBuilder:toString() #31
        `---[17.53% 0.0706ms ] java.io.PrintStream:println() #31
根据调用耗时过滤
[arthas@14964]$ trace  com.example.threaddemo.MathGame run '#cost > 0.4'
Press Q or Ctrl+C to abort.
Affect(class count: 1 , method count: 1) cost in 17 ms, listenerId: 7
`---ts=2024-06-27 10:50:45;thread_name=main;id=1;is_daemon=false;priority=5;TCCL=sun.misc.Launcher$AppClassLoader@18b4aac2
    `---[0.886699ms] com.example.threaddemo.MathGame:run()
        +---[93.73% 0.831099ms ] com.example.threaddemo.MathGame:primeFactors() #28
        `---[4.13% 0.0366ms ] com.example.threaddemo.MathGame:print() #29
只会展示耗时大于 0.4ms 的调用路径,有助于在排查问题的时候,只关注异常情况
trace 多个类或者多个函数
trace 命令只会 trace 匹配到的函数里的子调用,并不会向下 trace 多层。因为 trace 是代价比较贵的,多层 trace 可能会导致最终要 trace 的类和函数非常多。
可以用正则表匹配路径上的多个类和函数,一定程度上达到多层 trace 的效果。
[arthas@6060]$ trace -E  com.example.threaddemo.MathGame|com.example.threaddemo.MathGame.DateTimeUtils  run|getNow
Press Q or Ctrl+C to abort.
Affect(class count: 2 , method count: 2) cost in 44 ms, listenerId: 3
`---ts=2024-06-27 11:29:25;thread_name=main;id=1;is_daemon=false;priority=5;TCCL=sun.misc.Launcher$AppClassLoader@18b4aac2
    `---[0.3146ms] com.example.threaddemo.MathGame:run()
        +---[42.08% 0.132399ms ] com.example.threaddemo.MathGame:primeFactors() #28
        |   `---[8.23% 0.0109ms ] com.example.threaddemo.MathGame$DateTimeUtils:getNow()
`---[17.80% 0.056001ms ] com.example.threaddemo.MathGame:print() #29-
命令三:tt
说明
watch 虽然很方便和灵活,但需要提前想清楚观察表达式的拼写,这对排查问题而言要求太高,因为很多时候我们并不清楚问题出自于何方,只能靠蛛丝马迹进行猜测。
这个时候如果能记录下当时方法调用的所有入参和返回值、抛出的异常会对整个问题的思考与判断非常有帮助。
注意事项
- tt 命令的实现是:把函数的入参/返回值等,保存到一个
Map<Integer, TimeFragment>里,默认的大小是 100。 - tt 相关功能在使用完之后,需要手动释放内存,否则长时间可能导致OOM。退出 arthas 不会自动清除 tt 的缓存 map。
参数说明:
| tt的参数 | 说明 |
|---|---|
| -t | 记录某个方法在一个时间段中的调用 |
| -l | 显示所有已经记录的列表 |
| -n 次数 | 只记录多少次 |
| -s 表达式 | 搜索表达式 |
| -i 索引号 | 查看指定索引号的详细调用信息 |
| -p | 重新调用:指定的索引号时间碎片 |
命令实践
记录调用 - 对于一个最基本的使用来说,就是记录下当前方法的每次调用环境现场。
tt -t com.example.threaddemo.MathGame primeFactors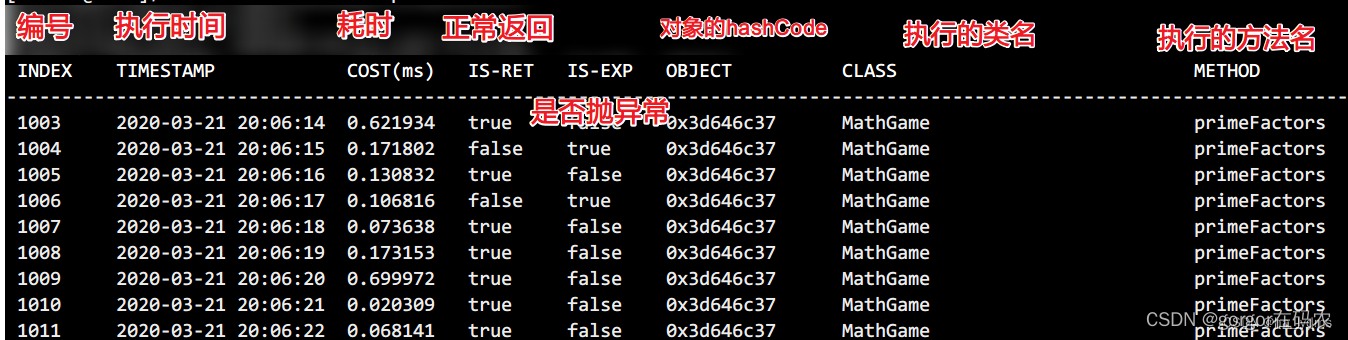
检索调用记录
当你用 tt 记录了一大片的时间片段之后,你希望能从中筛选出自己需要的时间片段,这个时候你就需要对现有记录进行检索。
[arthas@6060]$ tt -l
 INDEX  TIMESTAMP          COST(ms  IS-RE  IS-EXP  OBJECT        CLASS                      METHOD
                           )        T
-----------------------------------------------------------------------------------------------------------------------
 1000   2024-06-27 14:02:  0.2222   false  true    0x34033bd0    MathGame                   primeFactors
        30
 1001   2024-06-27 14:02:  0.0396   false  true    0x34033bd0    MathGame                   primeFactors
        31
 1002   2024-06-27 14:02:  0.1194   true   false   0x34033bd0    MathGame                   primeFactors
我需要筛选出 primeFactors 方法的调用信息
[arthas@6060]$ tt -s 'method.name=="primeFactors"'
 INDEX  TIMESTAMP          COST(ms  IS-RE  IS-EXP  OBJECT        CLASS                      METHOD
                           )        T
-----------------------------------------------------------------------------------------------------------------------
 1000   2024-06-27 14:02:  0.2222   false  true    0x34033bd0    MathGame                   primeFactors
        30
 1001   2024-06-27 14:02:  0.0396   false  true    0x34033bd0    MathGame                   primeFactors
查看调用信息
对于具体一个时间片的信息而言,你可以通过 -i 参数后边跟着对应的 INDEX 编号查看到他的详细信息。
[arthas@6060]$ tt -i 1000
 INDEX            1000
 GMT-CREATE       2024-06-27 14:02:30
 COST(ms)         0.2222
 OBJECT           0x34033bd0
 CLASS            com.example.threaddemo.MathGame
 METHOD           primeFactors
 IS-RETURN        false
 IS-EXCEPTION     true
 PARAMETERS[0]    @Integer[-74817]
                                    rgumentException: number is: -74817, need >= 2
                                    le.threaddemo.MathGame.primeFactors(Unknown Source)
                                             demo.MathGame.run(Unknown Source)
                                            ddemo.MathGame.main(Unknown Source)
Affect(row-cnt:1) cost in 9 ms.
重做一次调用
当你稍稍做了一些调整之后,你可能需要前端系统重新触发一次你的调用,此时得求爷爷告奶奶的需要前端配合联调的同学再次发起一次调用。而有些场景下,这个调用不是这么好触发的。
tt 命令由于保存了当时调用的所有现场信息,所以我们可以自己主动对一个 INDEX 编号的时间片自主发起一次调用,从而解放你的沟通成本。此时你需要 -p 参数。通过 --replay-times 指定 调用次数,通过 --replay-interval 指定多次调用间隔(单位 ms, 默认 1000ms)
[arthas@6060]$ tt -i 1004 -p
 RE-INDEX       1004
 GMT-REPLAY     2024-06-27 14:18:18
 OBJECT         0x34033bd0
 CLASS          com.example.threaddemo.MathGame
 METHOD         primeFactors
 PARAMETERS[0]  @Integer[151809]
 IS-RETURN      true
 IS-EXCEPTION   false
 COST(ms)       0.0507
 RETURN-OBJ     @ArrayList[
                    @Integer[3],
                    @Integer[7],
                    @Integer[7229],
                ]
Time fragment[1004] successfully replayed 1 times.
你会发现结果虽然一样,但调用的路径发生了变化,由原来的程序发起变成了 Arthas 自己的内部线程发起的调用了。
通过索引删除指定的 tt 记录
tt -d 1001
清除所有的 tt 记录
tt --delete-all-
命令四: dashboard
说明
当运行在 Ali-tomcat 时,会显示当前 tomcat 的实时信息,如 HTTP 请求的 qps, rt, 错误数, 线程池信息等等。
参数说明
| 参数名称 | 参数说明 |
|---|---|
| [i:] | 刷新实时数据的时间间隔 (ms),默认 5000ms |
| [n:] | 刷新实时数据的次数 |
命令实践
dashboard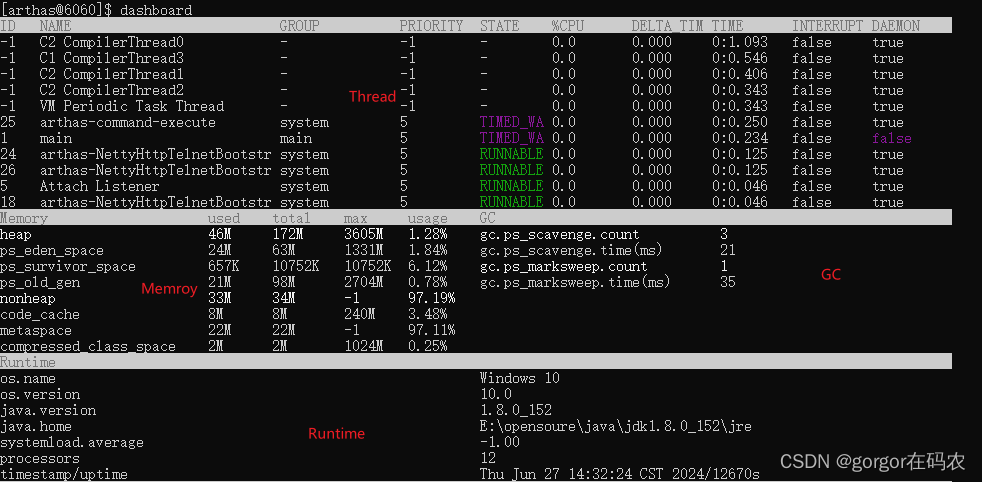
数据说明
- ID: Java 级别的线程 ID,注意这个 ID 不能跟 jstack 中的 nativeID 一一对应。
- NAME: 线程名
- GROUP: 线程组名
- PRIORITY: 线程优先级, 1~10 之间的数字,越大表示优先级越高
- STATE: 线程的状态
- CPU%: 线程的 cpu 使用率。比如采样间隔 1000ms,某个线程的增量 cpu 时间为 100ms,则 cpu 使用率=100/1000=10%
- DELTA_TIME: 上次采样之后线程运行增量 CPU 时间,数据格式为
秒 - TIME: 线程运行总 CPU 时间,数据格式为
分:秒 - INTERRUPTED: 线程当前的中断位状态
- DAEMON: 是否是 daemon 线程
-
命令五: thread
说明
查看当前线程信息,查看线程的堆栈
参数说明
| 参数名称 | 参数说明 |
|---|---|
| id | 线程 id |
| [n:] | 指定最忙的前 N 个线程并打印堆栈 |
| [b] | 找出当前阻塞其他线程的线程 |
[i <value>] | 指定 cpu 使用率统计的采样间隔,单位为毫秒,默认值为 200 |
| [--all] | 显示所有匹配的线程 |
命令实践
thread 查看所有的线程
thread cid 显示指定线程ID的运行堆栈
thread cid | grep 'main(' 过滤线程
thread -n 1 展示当前最忙的前N个线程并打印堆栈
thread -b 找出当前阻塞其他线程的线程。一般死锁时用
thread -n 3 -i 1000 指定最忙的3个线程1s种内的cpu占比
-
命令六: heapdump
说明
dump java heap, 类似 jmap 命令的 heap dump 功能。
命令实践
dump 到指定文件
[arthas@58205]$ heapdump arthas-output/dump.hprof
Dumping heap to arthas-output/dump.hprof ...
Heap dump file created
提示
生成文件在arthas-output目录,可以通过浏览器下载: http://localhost:8563/arthas-output/
只 dump live 对象
[arthas@58205]$ heapdump --live /tmp/dump.hprof
Dumping heap to /tmp/dump.hprof ...
Heap dump file created
dump 到临时文件
[arthas@58205]$ heapdump
Dumping heap to /var/folders/my/wy7c9w9j5732xbkcyt1mb4g40000gp/T/heapdump2019-09-03-16-385121018449645518991.hprof...
Heap dump file created
实战
功能一: 热更新字节码
案例代码
@RestController
@RequestMapping("/hot")
public class HotController {

    @RequestMapping("/test")
    @ResponseBody
    public String test(){
        boolean flag = true;
        if (flag) {
            System.out.println("开始处理逻辑");
            throw new RuntimeException("出异常了");
        }
        System.out.println("结束流程");
        return "hot test";
    }
}
命令排查流程
第一步:`jad命令` 将需要更改的文件先进行反编译,保存下来 ,编译器修改,-c 指定这个类的classloader的哈希值,–source-only只显示源码,最后是文件反编译之后的存放路径.#我们将HotController.java中的throw new RuntimeException("出异常了")代码删掉,修改完后需要将类重新加载到JVM
jad --source-only com.gorgor.sms.test.HotController > E:/test/HotController.java第二步:`SC命令` 查找当前类是哪个classLoader加载的,首先,使用sc命令找到要修改的类.sc全称-search class, -d表示detail,主要是为了获取classLoader的hash值
sc -d *HotController | grep classLoader
结果: classLoaderHash 6267c3bb #类加载器 编号 第三步:`MC命令` 用指定的classloader重新将类在内存中编译
mc -c 18b4aac2 E:/test/HotController.java -d D:/study/sms-demo/target/classesredefine D:/study/sms-demo/target/classes/com/gorgor/sms/test/HotController.class:`redefine命令` 将编译后的类加载到JVM,参数是编译后的.class文件地址
redefine D:/study/sms-demo/target/classes/com/gorgor/sms/test/HotController.class


 314
314

 被折叠的 条评论
为什么被折叠?
被折叠的 条评论
为什么被折叠?
 到【灌水乐园】发言


