


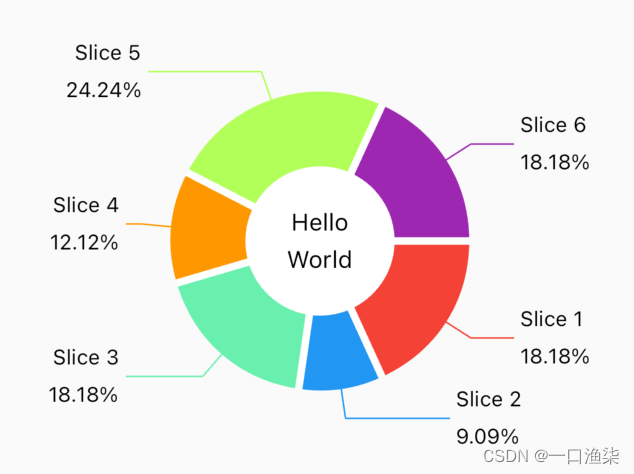
实现效果如下:
首先,在绘制前先定义好一个实体类用于存放数据;
class PieChartModel {
  final String name;
  final double value;
  final Color color;
  final double radius;
  final double startAngle;

  PieChartModel({
    required this.name,
    required this.value,
    required this.color,
    required this.radius,
    required this.startAngle,
  });
}
根据实体类定义好显示的数据列表:
 final List<PieChartModel> models = [
    PieChartModel(
      name: 'Slice 1',
      value: 30.0,
      color: Colors.red,
      radius: 100.0,
      startAngle: 0.0,
    ),
    PieChartModel(
      name: 'Slice 2',
      value: 15.0,
      color: Colors.blue,
      radius: 100.0,
      startAngle: 0.0,
    ),
    PieChartModel(
      name: 'Slice 3',
      value: 30.0,
      color: Colors.greenAccent,
      radius: 100.0,
      startAngle: 0.0,
    ),
    PieChartModel(
      name: 'Slice 4',
      value: 20.0,
      color: Colors.orange,
      radius: 100.0,
      startAngle: 0.0,
    ),
    PieChartModel(
      name: 'Slice 5',
      value: 40.0,
      color: Colors.lightGreenAccent,
      radius: 100.0,
      startAngle: 0.0,
    ),
    PieChartModel(
      name: 'Slice 6',
      value: 30.0,
      color: Colors.purple,
      radius: 100.0,
      startAngle: 0.0,
    ),
  ];
基于CustomPaint实现以下几个步骤: 自定义PieChartPainter继承CustomPainter;
通过paint方法进行绘制实现:
class PieChartPainter extends CustomPainter {
void paint(Canvas canvas, Size size) {
// 移动到中心点
canvas.translate(size.width / 2, size.height / 2);
// 绘制饼状图
_drawPie(canvas, size);
// 绘制扇形分割线
_drawSpaceLines(canvas);
// 绘制中心圆
_drawHole(canvas, size);
}
}
一:绘制饼状图
我们以整个画布的中点为圆点,然后计算出每个扇形的角度区域,通过canvas.drawArc绘制扇形,同时绘制指引线以及显示文本
  void _drawPie(Canvas canvas, Size size) {
    // 开始起点角度
    var startAngle = 0.0;
    var sumValue = models.fold<double>(0.0, (sum, model) => sum + model.value);

    for (var model in models) {
      Paint paint = Paint()
        ..style = PaintingStyle.fill
        ..color = model.color;

      var sweepAngle = model.value / sumValue * 360;

      canvas.drawArc(
        Rect.fromCircle(radius: model.radius, center: Offset.zero),
        startAngle * pi / 180,
        sweepAngle * pi / 180,
        true,
        paint,
      );

      // 为每一个区域绘制延长线和文字
      _drawLineAndText(canvas, size, model.radius, startAngle, sweepAngle, model);

      startAngle += sweepAngle;
    }
  }
   // 绘制延长线以及文本
  void _drawLineAndText(
      Canvas canvas,
      Size size,
      double radius,
      double startAngle,
      double sweepAngle,
      PieChartModel model,
      ) {
    var ratio = (sweepAngle / 360.0 * 100).toStringAsFixed(2);
    // 处理名称超长问题,最多2行,超出部分以省略号显示
    // 10 -> 最多10个字位数
    var top = Text(_getWrappedText(model.name, 10));
    var topTextPainter = getTextPainter(top);
    // 百分比显示
    var bottom = Text("$ratio%");
    var bottomTextPainter = getTextPainter(bottom);

    var startX = radius * (cos((startAngle + (sweepAngle / 2)) * (pi / 180)));
    var startY = radius * (sin((startAngle + (sweepAngle / 2)) * (pi / 180)));

    // 第一段折线长度
    var firstLine = radius / 5;
    var secondLine = max(bottomTextPainter.width, topTextPainter.width) + radius / 4;

    var pointX = (radius + firstLine) *
        (cos((startAngle + (sweepAngle / 2)) * (pi / 180)));
    var pointY = (radius + firstLine) *
        (sin((startAngle + (sweepAngle / 2)) * (pi / 180)));

    // 第二段折线长度
    var marginOffset = 20.0;
    var endX = 0.0;

    if (pointX - startX > 0) {
      endX = min(pointX + secondLine, size.width / 2 - marginOffset);
      secondLine = endX - pointX;
    } else {
      endX = max(pointX - secondLine, -size.width / 2 + marginOffset);
      secondLine = pointX - endX;
    }

    Paint paint = Paint()
      ..style = PaintingStyle.fill
      ..strokeWidth = 1
      ..color = model.color;

    // 绘制指引线
    canvas.drawLine(Offset(startX, startY), Offset(pointX, pointY), paint);
    canvas.drawLine(Offset(pointX, pointY), Offset(endX, pointY), paint);

    // 绘制显示文本
    var offset = 4;
    var textWidth = bottomTextPainter.width;
    var textStartX = 0.0;
    textStartX = _calculateTextStartX(
        pointX, startX, textWidth, secondLine, textStartX, offset.toDouble());
    bottomTextPainter.paint(canvas, Offset(textStartX, pointY + offset));

    textWidth = topTextPainter.width;
    var textHeight = topTextPainter.height;
    textStartX = _calculateTextStartX(
        pointX, startX, textWidth, secondLine, textStartX, offset.toDouble());
    topTextPainter.paint(
      canvas,
      Offset(textStartX, pointY - offset - textHeight),
    );

  }

   //处理名称超长问题,最多2行,超出部分以省略号显示
  String _getWrappedText(String text, int maxWidth) {
    if (text.length <= maxWidth) {
      return text;
    }

    String wrappedText = '';
    int startIndex = 0;
    int endIndex = maxWidth;
    int lineCount = 0;

    while (endIndex < text.length && lineCount < 2) {
      // 在endIndex处换行文本
      wrappedText += '${text.substring(startIndex, endIndex)}\n';
      startIndex = endIndex;
      endIndex += maxWidth;
      lineCount++;
    }

    // 修剪尾随空格和换行符
    wrappedText = wrappedText.trimRight();

    // 如果有剩余的文本,添加省略号
    if (endIndex < text.length) {
      wrappedText = '${wrappedText.substring(0, wrappedText.length - 3)}...';
    }

    return wrappedText;
  }

  // 文本样式绘制
  TextPainter getTextPainter(Text text) {
    var inlineSpan = TextSpan(
    text: text.data,
    style: const TextStyle(
      color: Colors.black
    ),
    );
    var textPainter = TextPainter(
      text: inlineSpan,
      textDirection: TextDirection.ltr,
    );
    textPainter.layout();
    return textPainter;
  }

  // 文本显示起点位置
  double _calculateTextStartX(
      double pointX,
      double startX,
      double textWidth,
      double secondLine,
      double textStartX,
      double offset,
      ) {
    if (pointX - startX > 0) {
      textStartX = pointX + secondLine + offset;
    } else {
      textStartX = pointX - secondLine - textWidth - offset;
    }
    return textStartX;
  }
}
二:绘制扇形分割线
在绘制完扇形之后,然后在扇形的开始的那条边上绘制一条直线,起点为圆点,长度为扇形半径,终点的位置根据半径和扇形开始的那条边的角度用三角函数进行计算,然后通过canvas.drawLine进行绘制。
  // 绘制分割线
  void _drawSpaceLines(Canvas canvas) {
    var sumValue = models.fold<double>(0.0, (sum, model) => sum + model.value);
    var startAngle = 0.0;
    for (var model in models) {
      drawLine(canvas, startAngle, model.radius);
      startAngle += model.value / sumValue * 360;
    }
  }

  void drawLine(Canvas canvas, double angle, double radius) {
    var endX = cos(angle * pi / 180) * radius;
    var endY = sin(angle * pi / 180) * radius;
    Paint paint = Paint()
      ..style = PaintingStyle.fill
      ..color = Colors.white
      ..strokeWidth = 5; // 分割线大小
    canvas.drawLine(Offset.zero, Offset(endX, endY), paint);
  }
三:绘制内部中心圆以及显示文本
这里可以根据实际情况,设置传入的参数判断是否需要绘制这个圆以及中心显示文本,使用canvas.drawCircle进行绘制一个与背景色一致的圆。
  // 绘制中心空白区域 以及 显示文本
  void _drawHole(Canvas canvas, Size size) {
    Paint paint = Paint()
      ..style = PaintingStyle.fill
      ..color = Colors.white;
    canvas.drawCircle(Offset.zero, 50, paint);

    double textSpacing = 3; // 中心文本上下间距

    TextPainter topTextPainter = TextPainter(
      text: const TextSpan(
        text: 'Hello',
        style: TextStyle(
          color: Colors.black,
          fontSize: 16,
        ),
      ),
      textDirection: TextDirection.ltr,
    );
    topTextPainter.layout();
    Offset topTextOffset = Offset(-topTextPainter.width / 2, -topTextPainter.height - textSpacing);
    topTextPainter.paint(canvas, topTextOffset);

    TextPainter bottomTextPainter = TextPainter(
      text: const TextSpan(
        text: 'World',
        style: TextStyle(
          color: Colors.black,
          fontSize: 16,
        ),
      ),
      textDirection: TextDirection.ltr,
    );
    bottomTextPainter.layout();
    Offset bottomTextOffset = Offset(-bottomTextPainter.width / 2, textSpacing);
    bottomTextPainter.paint(canvas, bottomTextOffset);
  }
至此带指引线百分比饼状图就顺利实现了~
完整代码如下:
import 'package:flutter/material.dart';
import 'dart:math';
void main() {
runApp(const MyApp());
}
class MyApp extends StatelessWidget {
const MyApp({super.key});
Widget build(BuildContext context) {
return const MaterialApp(
title: 'Pie Chart Demo',
home: PieChartDemo(),
);
}
}
class PieChartDemo extends StatelessWidget {
const PieChartDemo({super.key});
Widget build(BuildContext context) {
return Scaffold(
body: Center(
child: Container(
color: Colors.grey,
child: CustomPaint(
size: const Size(300, 0),
painter: PieChartPainter(),
),
),
),
);
}
}
class PieChartPainter extends CustomPainter {
final List<PieChartModel> models = [
PieChartModel(
name: 'Slice 1',
value: 30.0,
color: Colors.red,
radius: 100.0,
startAngle: 0.0,
),
PieChartModel(
name: 'Slice 2',
value: 15.0,
color: Colors.blue,
radius: 100.0,
startAngle: 0.0,
),
PieChartModel(
name: 'Slice 3',
value: 30.0,
color: Colors.greenAccent,
radius: 100.0,
startAngle: 0.0,
),
PieChartModel(
name: 'Slice 4',
value: 20.0,
color: Colors.orange,
radius: 100.0,
startAngle: 0.0,
),
PieChartModel(
name: 'Slice 5',
value: 40.0,
color: Colors.lightGreenAccent,
radius: 100.0,
startAngle: 0.0,
),
PieChartModel(
name: 'Slice 6',
value: 30.0,
color: Colors.purple,
radius: 100.0,
startAngle: 0.0,
),
];
void paint(Canvas canvas, Size size) {
// 移动到中心点
canvas.translate(size.width / 2, size.height / 2);
// 绘制饼状图
_drawPie(canvas, size);
// 绘制扇形分割线
_drawSpaceLines(canvas);
// 绘制中心圆
_drawHole(canvas, size);
}
bool shouldRepaint(covariant CustomPainter oldDelegate) {
return oldDelegate != this;
}
void _drawPie(Canvas canvas, Size size) {
// 开始起点角度
var startAngle = 0.0;
var sumValue = models.fold<double>(0.0, (sum, model) => sum + model.value);
for (var model in models) {
Paint paint = Paint()
..style = PaintingStyle.fill
..color = model.color;
var sweepAngle = model.value / sumValue * 360;
canvas.drawArc(
Rect.fromCircle(radius: model.radius, center: Offset.zero),
startAngle * pi / 180,
sweepAngle * pi / 180,
true,
paint,
);
// 为每一个区域绘制延长线和文字
_drawLineAndText(
canvas, size, model.radius, startAngle, sweepAngle, model);
startAngle += sweepAngle;
}
}
// 绘制延长线以及文本
void _drawLineAndText(
Canvas canvas,
Size size,
double radius,
double startAngle,
double sweepAngle,
PieChartModel model,
) {
var ratio = (sweepAngle / 360.0 * 100).toStringAsFixed(2);
// 处理名称超长问题,最多2行,超出部分以省略号显示
// 10 -> 最多10个字位数
var top = Text(_getWrappedText(model.name, 10));
var topTextPainter = getTextPainter(top);
// 百分比显示
var bottom = Text("$ratio%");
var bottomTextPainter = getTextPainter(bottom);
var startX = radius * (cos((startAngle + (sweepAngle / 2)) * (pi / 180)));
var startY = radius * (sin((startAngle + (sweepAngle / 2)) * (pi / 180)));
// 第一段折线长度
var firstLine = radius / 5;
var secondLine =
max(bottomTextPainter.width, topTextPainter.width) + radius / 4;
var pointX = (radius + firstLine) *
(cos((startAngle + (sweepAngle / 2)) * (pi / 180)));
var pointY = (radius + firstLine) *
(sin((startAngle + (sweepAngle / 2)) * (pi / 180)));
// 第二段折线长度
var marginOffset = 20.0;
var endX = 0.0;
if (pointX - startX > 0) {
endX = min(pointX + secondLine, size.width / 2 - marginOffset);
secondLine = endX - pointX;
} else {
endX = max(pointX - secondLine, -size.width / 2 + marginOffset);
secondLine = pointX - endX;
}
Paint paint = Paint()
..style = PaintingStyle.fill
..strokeWidth = 1
..color = model.color;
// 绘制指引线
canvas.drawLine(Offset(startX, startY), Offset(pointX, pointY), paint);
canvas.drawLine(Offset(pointX, pointY), Offset(endX, pointY), paint);
// 绘制显示文本
var offset = 4;
var textWidth = bottomTextPainter.width;
var textStartX = 0.0;
textStartX = _calculateTextStartX(
pointX, startX, textWidth, secondLine, textStartX, offset.toDouble());
bottomTextPainter.paint(canvas, Offset(textStartX, pointY + offset));
textWidth = topTextPainter.width;
var textHeight = topTextPainter.height;
textStartX = _calculateTextStartX(
pointX, startX, textWidth, secondLine, textStartX, offset.toDouble());
topTextPainter.paint(
canvas,
Offset(textStartX, pointY - offset - textHeight),
);
}
//处理名称超长问题,最多2行,超出部分以省略号显示
String _getWrappedText(String text, int maxWidth) {
if (text.length <= maxWidth) {
return text;
}
String wrappedText = '';
int startIndex = 0;
int endIndex = maxWidth;
int lineCount = 0;
while (endIndex < text.length && lineCount < 2) {
// 在endIndex处换行文本
wrappedText += '${text.substring(startIndex, endIndex)}\n';
startIndex = endIndex;
endIndex += maxWidth;
lineCount++;
}
// 修剪尾随空格和换行符
wrappedText = wrappedText.trimRight();
// 如果有剩余的文本,添加省略号
if (endIndex < text.length) {
wrappedText = '${wrappedText.substring(0, wrappedText.length - 3)}...';
}
return wrappedText;
}
// 文本样式绘制
TextPainter getTextPainter(Text text) {
var inlineSpan = TextSpan(
text: text.data,
style: const TextStyle(color: Colors.black),
);
var textPainter = TextPainter(
text: inlineSpan,
textDirection: TextDirection.ltr,
);
textPainter.layout();
return textPainter;
}
// 文本显示起点位置
double _calculateTextStartX(
double pointX,
double startX,
double textWidth,
double secondLine,
double textStartX,
double offset,
) {
if (pointX - startX > 0) {
textStartX = pointX + secondLine + offset;
} else {
textStartX = pointX - secondLine - textWidth - offset;
}
return textStartX;
}
// 绘制分割线
void _drawSpaceLines(Canvas canvas) {
var sumValue = models.fold<double>(0.0, (sum, model) => sum + model.value);
var startAngle = 0.0;
for (var model in models) {
drawLine(canvas, startAngle, model.radius);
startAngle += model.value / sumValue * 360;
}
}
void drawLine(Canvas canvas, double angle, double radius) {
var endX = cos(angle * pi / 180) * radius;
var endY = sin(angle * pi / 180) * radius;
Paint paint = Paint()
..style = PaintingStyle.fill
..color = Colors.white
..strokeWidth = 5; // 分割线大小
canvas.drawLine(Offset.zero, Offset(endX, endY), paint);
}
// 绘制中心空白区域 以及 显示文本
void _drawHole(Canvas canvas, Size size) {
Paint paint = Paint()
..style = PaintingStyle.fill
..color = Colors.white;
canvas.drawCircle(Offset.zero, 50, paint);
double textSpacing = 3; // 中心文本上下间距
TextPainter topTextPainter = TextPainter(
text: const TextSpan(
text: 'Hello',
style: TextStyle(
color: Colors.black,
fontSize: 16,
),
),
textDirection: TextDirection.ltr,
);
topTextPainter.layout();
Offset topTextOffset =
Offset(-topTextPainter.width / 2, -topTextPainter.height - textSpacing);
topTextPainter.paint(canvas, topTextOffset);
TextPainter bottomTextPainter = TextPainter(
text: const TextSpan(
text: 'World',
style: TextStyle(
color: Colors.black,
fontSize: 16,
),
),
textDirection: TextDirection.ltr,
);
bottomTextPainter.layout();
Offset bottomTextOffset = Offset(-bottomTextPainter.width / 2, textSpacing);
bottomTextPainter.paint(canvas, bottomTextOffset);
}
}
class PieChartModel {
final String name;
final double value;
final Color color;
final double radius;
final double startAngle;
PieChartModel({
required this.name,
required this.value,
required this.color,
required this.radius,
required this.startAngle,
});
}


 1538
1538

 被折叠的 条评论
为什么被折叠?
被折叠的 条评论
为什么被折叠?
 到【灌水乐园】发言


